. 2019 Aug 22;8:e43582. doi: 10.7554/eLife.43582

Figure 2. VIH kinase and phosphatase activities regulate plant Pi homeostasis.

(A) Complementation of vih1 vih2 growth phenotypes. Shown are three independent lines for each construct grown in different Pi regimes. Plants were germinated in vertical 1/2MS plates for 8 d, transferred to Pi-free 1/2MS plates supplemented with either 0 mM, 1 mM or 10 mM Pi and grown for additional 6 d. Scale bars correspond to 2 cm. (B) Western blot showing the expression of VIH2-mCit, VIH1-mCit, VIH2KD/AA-mCit, VIH2RH/AA-mCit proteins (indicated by arrow heads) in the transgenic lines from (A) using an anti-GFP antibody. A Ponceau stain of the membrane is shown as loading control below. (C) Pooled Pi content of seedlings 14 DAG as shown in (A). For each position, four independent plants from each trangenic line were measured with two technical replicates. (D) qRT-PCR quantification of the PSI marker genes in seedlings shown in (A). Expression levels are represented as Z-scores. The original qRT-PCR data are shown in Supplementary file 3b.

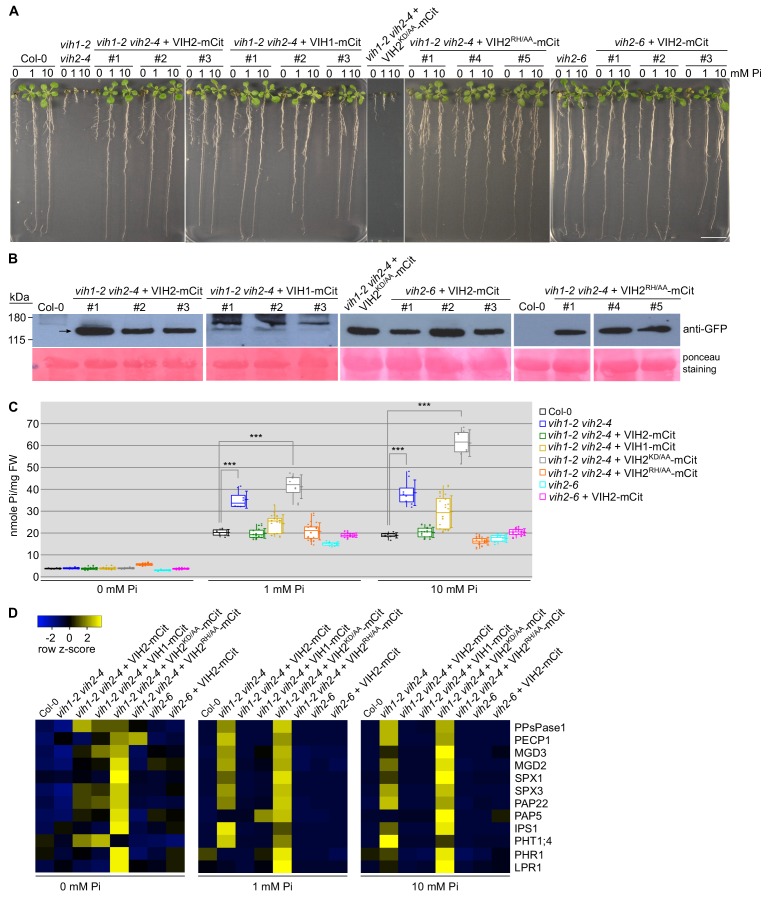
Figure 2.

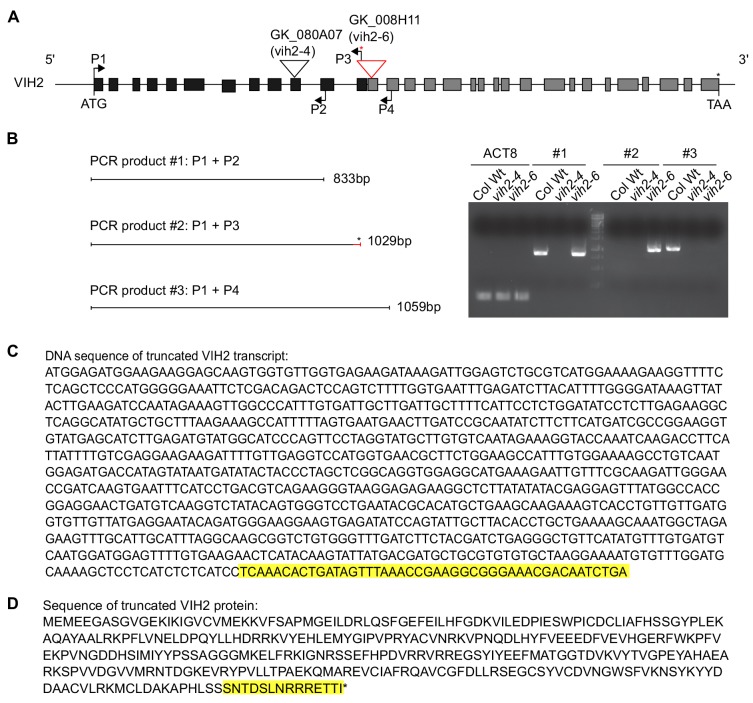
Figure 2—figure supplement 1. The vih2-6 transcript encodes a truncated VIH2 protein harboring the kinase domain only.

Figure 2—figure supplement 1.

(A) Positions of T-DNA insertions in the vih2-4 and vih2-6 alleles and transcript detection by RT-PCR analysis at the VIH2 locus (At3g01310). A red asterisk indicates the putative stop codon residing in the T-DNA sequence in the vih2-6 mutant, which is included in the reverse primer P3 (vih2-6_TDNA_R). The primer set P1 (VIH2cDNA_F) + P4 (VIH2-c-R) encompasses the transcript region from the ATG start codon to sequences adjacent to the T-DNA insertion position in vih2-6. (B) RT - PCR products #1, 2 and 3 are amplified by primer set P1 + P2 (VIH2-b-R), P1 + P3 and P1 + P4 using cDNA reverse-transcribed from 10 DAG Col-0 wild-type, vih2-4 and vih2-6 mutant seedlings. Transcripts of ACTIN8 (ACT8) were used as a cDNA input control. (C) DNA sequence of the truncated VIH2 transcript in vih2-6. The highlighted (yellow) sequence is from the left border of the inserted T-DNA. (D) Putative protein sequence of the truncated VIH2 in vih2-6. The additional residues (highlighted in yellow) originate from the left border of the T-DNA insertion.
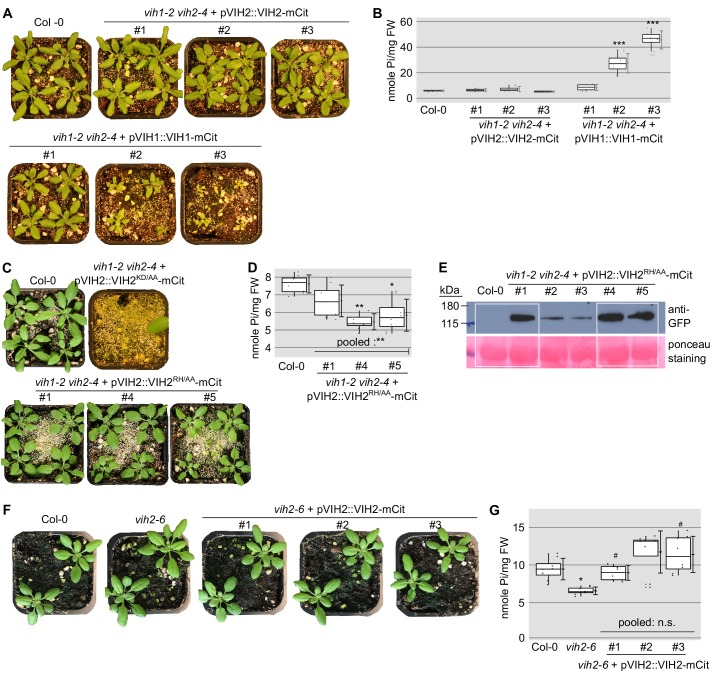
Figure 2—figure supplement 2. Growth phenotypes of soil-grown vih1-2 vih2-4 double mutant lines complemented with pVIH1::VIH1-mCit, pVIH2::VIH2-mCit, pVIH2::VIH2KD/AA-mCit or pVIH2::VIH2RH/AA-mCit.

Figure 2—figure supplement 2.

(A) Expression of VIH1-mCit or VIH2-mCit under the control of their endogenous promoter can complement the vih1-2 vih2-4 phenotype. Seedlings 7 DAG were transferred to soil and grown for 23 d. Note that in the case of the VIH1-mCit construct, we also observed partially complementing lines. (B) Shoot Pi content of plants 22 DAG shown in (A). For each position, four independent plants were measured with two technical replicates each. (C) Growth phenotypes of independent vih1-2 vih2-4 lines, complemented with pVIH2::VIH2KD/AA-mCit or pVIH2::VIH2RH/AA-mCit. All plants were transferred to soil 7 DAG and grown for 21 d, Col-0 wild-type plants are shown alongside. (D) Shoot Pi contents of plants 20 DAG described in (C) except the lethal vih1-2 vih2-4 complemented by pVIH2::VIH2KD/AA-mCit. For each boxed position, four independent plants were measured with two technical replicates each. (E) Western blot showing the VIH2RH/AA-mCit protein levels in the complementation lines described in (C), detected using an anti-GFP antibody. The white box highlights the lines shown in Figure 2B. (F) Growth phenotypes of the vih2-6 mutant expressing the kinase domain-only, and three independent lines of vih2-6 complemented with pVIH2::VIH2-mCit. Plants 7 DAG were transferred to soil and grown for 21 d. (G) Shoot Pi content of plants 20 DAG as described in (F). For each position, four independent plants were measured with two technical replicates each.
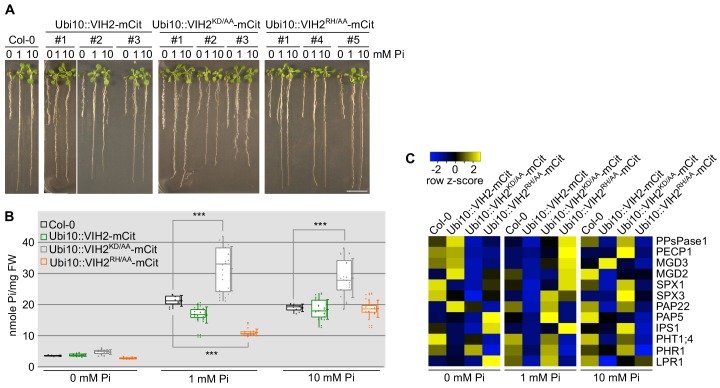
Figure 2—figure supplement 3. The kinase and phosphatase activities of VIH1 and VIH2 together control plant Pi homeostasis at seedling stage.

Figure 2—figure supplement 3.

(A) Growth phenotypes of seedlings over-expressing VIH2-mCit, VIH2KD/AA-mCit or VIH2RH/AA-mCit with a Ubi10 promoter in Col-0 wild-type background. Col-0 wild-type and three independent transgenic lines for each construct are shown. Seedlings 7 DAG were transplanted from 1/2MS plates to Pi-free 1/2MS liquid supplemented with 0 mM, 1 mM or 10 mM Pi, and grown for additional 6 d. (B) Pooled Pi content of seedlings 14 DAG described in (A). Four independent plants from each transgenic line were measured with two technical replicates each. (C) qRT-PCR quantification of the PSI marker genes in seedlings shown in (A). Expression levels are represented as Z-scores. The original data of qRT-PCR are shown in Supplementary file 3d.
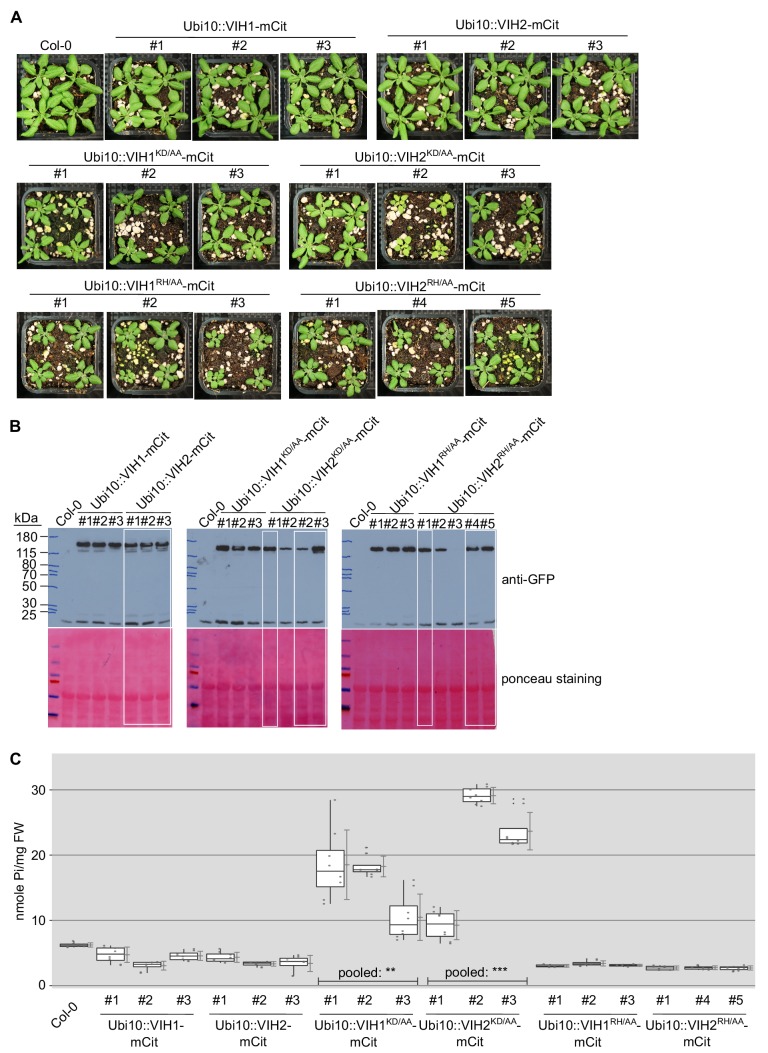
Figure 2—figure supplement 4. The kinase and phosphatase activities of VIH1 and VIH2 together control Pi homeostasis in soil-grown adult plants.

Figure 2—figure supplement 4.

(A) Growth phenotype of plants expressing Ubi10::VIH1-mCit, Ubi10::VIH2-mCit, Ubi10::VIH1KD/AA-mCit, Ubi10::VIH2KD/AA-mCit, Ubi10::VIH1RH/AA-mCit and Ubi10::VIH2RH/AA-mCit. Seedings 7 DAG were transferred to soil and grown for 21 d. (B) Western blot of VIH1-mCit, VIH2-mCit, VIH1KD/AA-mCit, VIH2KD/AA-mCit, VIH1RH/AA-mCit and VIH2RH/AA-mCit proteins, detected by an anti-GFP antibody. White boxes correspond to the lines shown in panels A and C and in Figure 2—figure supplement 3. (C) Shoot Pi contents of plants 20 DAG from selected lines described in (A). Four independent plants were measured with two technical replicates each.