. 2019 Aug 22;8:e43582. doi: 10.7554/eLife.43582

Figure 6. Changes in cellular ATP levels affect the relative PPIP5K kinase and phosphatase activities.

(A) Bi-functional PP-InsP activity assay of ScVip1. Reactions containing 2 μM protein, 40 μM 5PP-InsP5 and various ATP-Mg2+ concentrations were incubated at 37°C for 45 min. Product PP-InsPs were separated on a native PAGE gel and stained with toluidine blue. The bands corresponding to InsP6, 1/5PP-InsP5, InsP8 and ATP are indicated by arrow heads. (B) Quantification of conversion of the 5-PP-InsP5 (substrate) to InsP6 (product) by full-length ScVip1 (FL) enzyme in reactions containing different concentrations of ATP-Mg2+, recorded by NMR specroscopy. (C) Col-0 seedlings 6 DAG were transplanted from 1/2MS plates to Pi-deficient 1/2MS plates and incubate 3 days more. Then, the seedlings were transplanted again to Pi-deficient 1/2MS plates supplemented with 0 mM Pi, 0.5 mM Pi or 0.5 mM Phi, and grown for additional 8 hr, 24 hr or 48 hr. (D) Determination of the cellular ATP and ADP concentrations of the seedlings shown in (C). (E) qRT-PCR quantification of PSI marker genes in the seedlings shown in (C). Expression levels are represented as Z-scores. The original qRT-PCR data are shown in Supplementary file 3e. (F) Quantification of seedling fresh weight, primary root length and cellular Pi concentrations of the plants shown in (C).

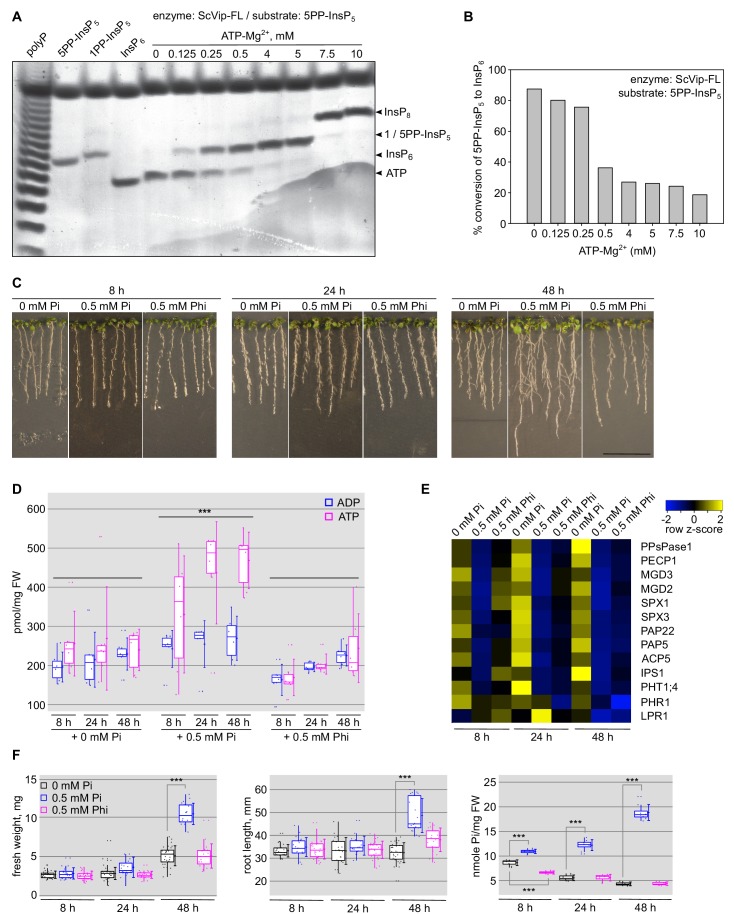
Figure 6.

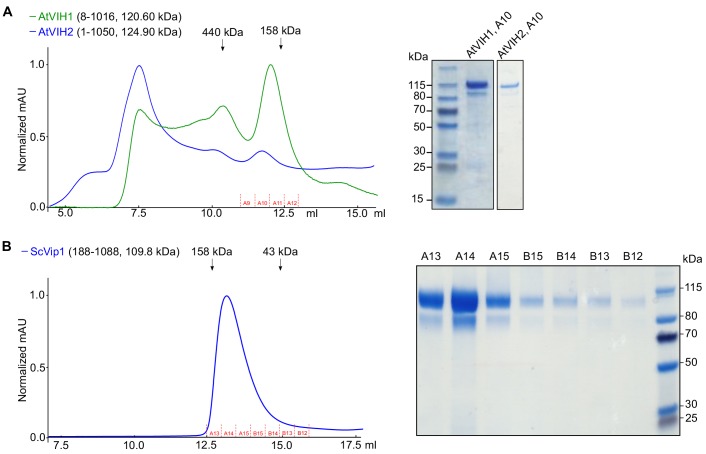
Figure 6—figure supplement 1. Purification of full-length AtVIH1, AtVIH2 and ScVip1 proteins from insect cells.

Figure 6—figure supplement 1.

(A) Size-exclusion chromatography traces of purified full-length AtVIH1 (residues 8–1016) and AtVIH2 (residues 1–1050). A coomassie-stained SDS-PAGE gel showing the content of the peak fraction (A10) is shown alongside. (B) Size-exclusion chromatography trace of purified recombinant ScVip1 (residues 188–1088) and fractions harvested for the enzymatic assay shown in C (fractions A13-B12). A coomassie-stained SDA-PAGE gel showing the respective fractions of ScVip1 is shown alongside.
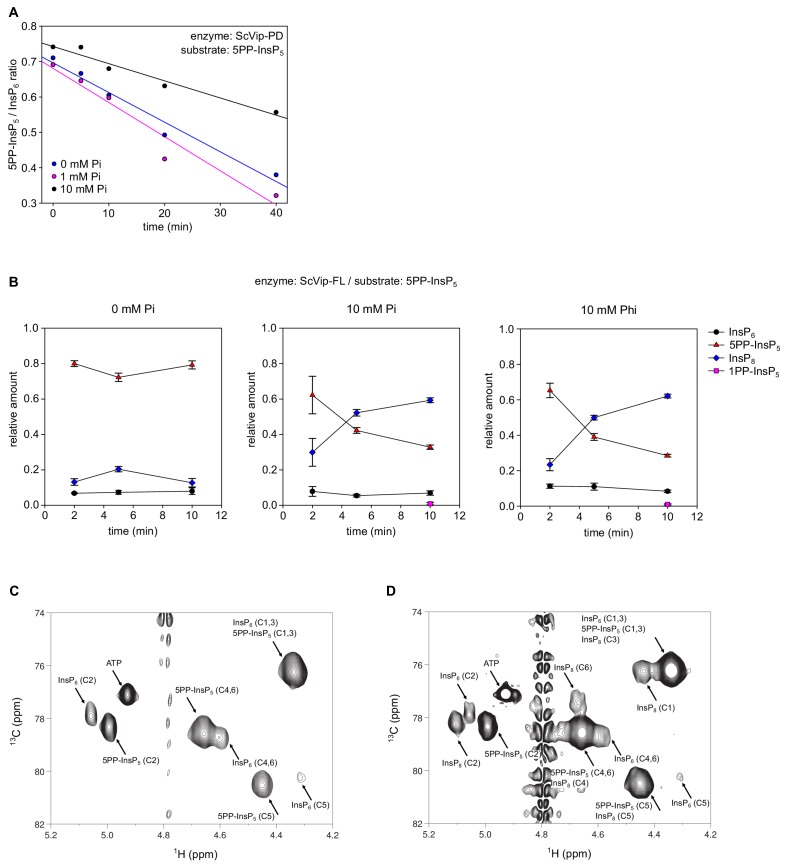
Figure 6—figure supplement 2. Pi inhibits the ScVip1-PD phosphatase activity, but promotes synthesis of InsP8 catalyzed by full-length ScVip1.

Figure 6—figure supplement 2.

(A) Decay of the [13C6]5PP-InsP5 substrate during the NMR-time course experiment. 2 µM ScVip1-FL was incubated with [13C6]5-PP-InsP5 in the presence of 0 mM Pi (blue), 1 mM Pi (magenta) or 10 mM Pi (black). (B) Relative amount of products recorded by NMR in time-course kinase assays, incubating 1 µM full-length ScVip1 (FL) with 80 µM [13C6]5PP-InsP5 in the presence of 0 mM Pi, 10 mM Pi or 10 mM Pi, respectively. (C, D) 2D 1H-13C-HMBC spectra of the products produced by ScVip1-FL incubated with [13C6]5PP-InsP5 in the presence of 0 mM Pi (C) or 10 mM Pi (D) at 10 min.