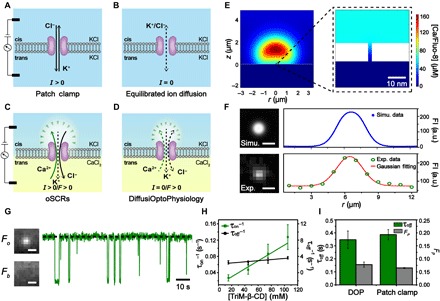
Fig. 1. DiffusiOptoPhysiology and its application in trimethyl-β-cyclodextrin sensing.

(A to D) Schematics of ion transport through a nanopore in different measurement platforms. Electromigration and diffusion of ions are indicated by solid and dashed lines, respectively. (A) During electrophysiology recording, electrophoretic motion of K+ and Cl− through a nanopore is observed when a transmembrane potential is applied via a pair of Ag/AgCl electrodes. (B) In the absence of electrodes, although thermal motion of ions across the nanopore exists in both directions, no net flow of ion transport should happen according to the rule of electroneutrality. (C) During optical single-channel recordings (oSCRs), directional motion of Ca2+, which is electrophoretically driven through a nanopore, establishes a steep Ca2+ concentration gradient. Upon binding with Fluo-8 in cis, the Fluo-8/Ca2+ complex around the pore vicinity emits strong fluorescence. (D) During DiffusiOptoPhysiology (DOP), a mild Ca2+ concentration gradient could be established around the pore vicinity due to the thermal motion of ions. Upon binding with Fluo-8, a weaker fluorescence emission than (C) is expected. (E) A cross-sectional view of the spatial distribution of the Fluo-8/Ca2+ complex around the pore. Dashed box: The zoomed-in view of the immediate vicinity area near the nanopore. (F) Top left: Corresponding image result from computer simulation. Top right: The simulated fluorescence intensity (FI) profile follows a Gaussian distribution. Bottom left: A representative frame acquired from DOP recording for a single wild-type (WT) α-hemolysin (α-HL) nanopore. Bottom right: The corresponding fluorescence intensity profile also follows a Gaussian distribution. Scale bars, 4 μm. a.u., arbitrary units. (G) Single-molecule sensing of trimethyl-β-cyclodextrin (TriM-β-CD) (75 mM) with an α-HL nanopore during DOP recording. Scale bars, 4 μm. (H) Plot of the reciprocals of the mean interevent intervals (1/τon) and mean dwell time (1/τoff) versus TriM-β-CD concentration. The mean and SD come from three independent experiments for each condition (n = 3). (I) Statistics of τoff and FP results acquired from DOP and electrophysiology recording at +20 mV, respectively. The DOP recordings (F to I) were performed with 1.5 M KCl, 400 μM EDTA, 40 μM Fluo-8, and 10 mM HEPES (pH 7.0) in cis and 0.75 M CaCl2 and 10 mM HEPES (pH 7.0) in trans. The electrophysiology recordings were performed with 1.5 M KCl and 10 mM HEPES (pH 7.0) in both sides of the membrane. TriM-β-CD was added to the cis side with a final concentration of 4 mM.
