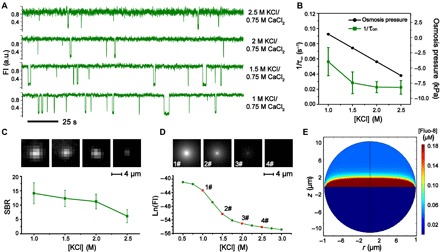
Fig. 2. Enhanced sensing performance with adjusted osmosis during DOP recording.

(A) Fluorescence traces acquired from DOP recording with different electrolyte combinations. DOP recordings were performed with α-HL nanopores. TriM-β-CD was added to cis with a final concentration of 15 mM. The interevent interval τon decreases when a larger osmosis gradient between cis and trans was established. (B) Plot of the osmotic pressure and 1/τon as a function of the KCl concentration in cis. The mean and SD are derived from three sets of independent experiments (n = 3). (C) The SBR analysis of fluorescent imaging results with different KCl concentrations in cis. Top: Representative images acquired from DOP recordings. The images from left to right were acquired by DOP recording with [KCl] in cis as 1.0, 1.5, 2.0, and 2.5 M, respectively. The value of SBR decreases when KCl concentration in cis increases. The mean and SD comes from five independent experiments (n = 5). Experiments in (A) to (C) were performed with 1 to 2.5 M KCl, 400 μM EDTA, 40 μM Fluo-8, and 10 mM HEPES (pH 7.0) in cis and 0.75 M CaCl2 and 10 mM HEPES (pH 7.0) in trans. (D) Plot of simulated fluorescence intensity as a function of the KCl concentration in cis. Top: Corresponding two-dimensional (2D) profiles of fluorescence intensities from the simulation, which resembles the results acquired from DOP in (C). The simulations were performed with 1 to 2.5 M KCl in cis and 0.75 M CaCl2 in trans. (E) A cross-sectional view of the spatial distribution of Fluo-8 in the simulation space. The boundary condition of the simulation was set as 1.0 M KCl in cis and 0.75 M CaCl2 in trans. Sustained osmotic flow from cis to trans gives rise to an enriched distribution of Fluo-8 in the vicinity of the DIB.
