
Fig. 3. Enhanced SBR with increased Ca2+ flux during DOP recording.
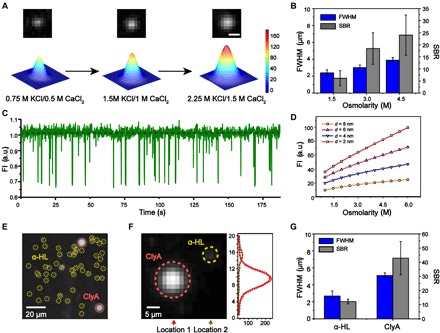
(A) Imaging results (top) and the corresponding 2D Gaussian fittings (bottom) acquired from DOP recording. The CaCl2 concentration in trans was increased when the KCl concentration in cis was adjusted so that the osmolarity concentrations were kept isotonic. The fluorescence spot, which corresponds to Ca2+ flux through a WT α-HL nanopore, becomes brighter with an increased Ca2+ flux. Scale bar, 4 μm. (B) The FWHM and SBR of the fluorescence imaging signals with different electrolyte osmolarity concentrations (n = 12). The DOP recordings in (A) and (B) were carried out with 0.75 to 2.25 M KCl, 400 μM EDTA, 40 μM Fluo-8, 10 mM HEPES, pH 7.0 in cis and 0.5–1.5 M CaCl2, 10 mM HEPES, pH 7.0 in trans. (C) A representative fluorescence trace shows PEG 1500 translocation signals through a WT α-HL nanopore, as acquired by DOP recording. PEG 1500 was added to the agarose substrate reaching a final concentration of 20 mM. The DOP recording was carried out with 2.25 M KCl, 400 μM EDTA, 40 μM Fluo-8, and 10 mM HEPES (pH 7.0) in cis and 1.5 M CaCl2 and 10 mM HEPES (pH 7.0) in trans. (D) Simulated total fluorescence intensity as a function of osmolarity concentration, shown for four different pore sizes with a diameter of 2, 4, 6, and 8 nm, respectively. The electrolyte concentrations were kept isotonic to avoid the interference of osmosis in this demonstration. (E) Simultaneously imaging of WT α-HL and ClyA-RR nanopores in the same DIB. Because of a larger channel conductance, ClyA-RR appears as a larger and brighter spot in comparison with WT α-HL in the same field of view (yellow dashed circles, WT α-HL; red dashed circles, ClyA-RR). Scale bar, 20 μm. (F) Left: Simultaneous imaging of an α-HL and a ClyA-RR. Right: The fluorescence intensity profile along vertical lines as marked by location 1 and 2, respectively. The fluorescence intensity profile is fitted with a Gaussian distribution. Scale bar, 5 μm. (G) The FWHM and SBR of the fluorescence imaging signals of WT α-HL and ClyA-RR (n = 5). DOP recordings as demonstrated in (E) and (F) were carried out with 1.5 M KCl, 400 μM EDTA, 40 μM Fluo-8, and 10 mM HEPES (pH 7.0) in cis and 1.5 M CaCl2 and 10 mM HEPES (pH 7.0) in trans.