
Fig. 4. dsDNA sensing using ClyA-RR nanopores.
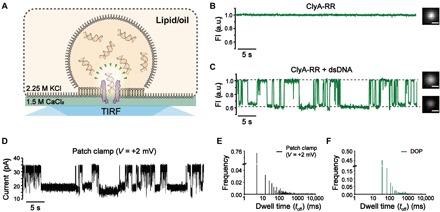
(A) The schematic diagram of dsDNA sensing using ClyA-RR during DOP recording. (B) DOP imaging of a ClyA-RR nanopore and the corresponding fluorescence trace. No dsDNA was added in the droplet. (C) DOP imaging of ClyA-RR nanopore and the corresponding fluorescence trace when dsDNA was added in the droplet with a final concentration of 2 μM. Successive deep and long-residing fluorescence blockades were observed. Scale bar, 5 μm. The DOP recordings in (B) and (C) were performed with 2.25 M KCl, 400 μM EDTA, 40 μM Fluo-8, and 10 mM HEPES (pH 7.0) in cis and 1.5 M CaCl2 and 10 mM HEPES (pH 7.0) in trans. dsDNA, which is of 78 bp, was add to cis with a final concentration of 2 μM. (D) Electrophysiology recording of dsDNA events recorded with ClyA-RR nanopore at +2 mV. With voltages as low as +2 mV, current blockages were still observable. The electrophysiology recordings were performed with 2.25 M KCl and 10 mM HEPES (pH 7.0) in cis and 1.5 M CaCl2 and 10 mM HEPES (pH 7.0) in trans. dsDNA, which is of 78 bp, was add to cis with a final concentration of 2 μM. (E) Histogram of the dwell time for dsDNA events extracted from electrophysiology recordings. (F) Histogram of the dwell time for dsDNA events extracted from DOP recordings. Because of a limited acquisition time (30 ms) of the electron-multiplying charge-coupled device in a large field of view, fast dsDNA translocations cannot be fully resolved. Data from DOP recordings (shown in olive color) were acquired with a frame rate of 30 ms. The electrophysiology trace (shown in black) were recorded with a +2-mV applied bias, sampled at 25 kHz, and low-pass–filtered at 1 kHz.