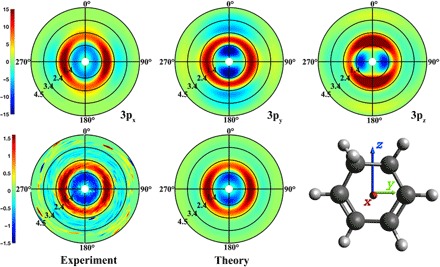
Fig. 2. The anisotropic components of the pump-probe scattering patterns.

Top: Computed patterns for alignments of the transition dipole moments along the x, y, and z directions. Bottom left: Experimental pattern at 1 ns. Bottom center: Simulated pattern with the optimal admixture of transition dipole moments.
