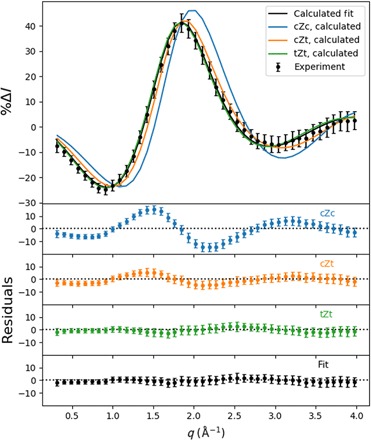
Fig. 5. Percent difference scattering signal, scaled for 100% excitation probability, for the hot (6.20 eV) molecules relative to the cold CHD (room temperature) molecules.

(Top) The experimental scattering signal, represented by black dots with error bars (given in 1σ), and the theoretical patterns to the three conformers, given in blue, orange, and green. A fit to a mixture of the three theoretical signals (20% cZt, 80% tZt) is given as a black line. (Bottom) The separate residuals of the experimental percent difference scattering signals with respect to each of the HT theoretical patterns and the optimal admixture.
