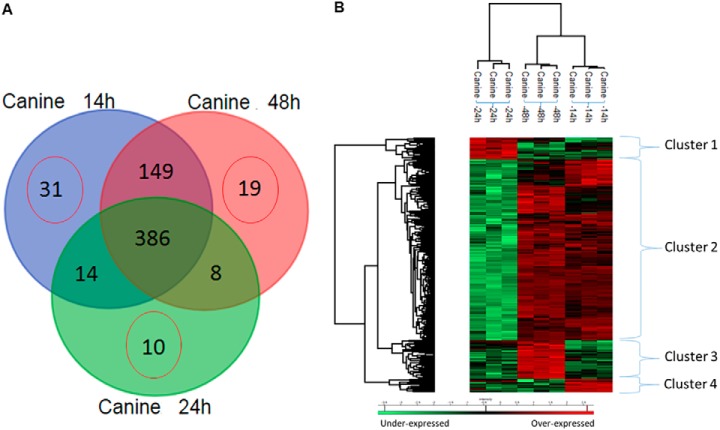
Fig. 4.
Proteomic analyses. (A) Venn diagram of shotgun proteomic analyses of proteins issued from bone marrow Stem cells conditioned medium collected at 14 h, 24 h, and 48 h. Specific proteins to each condition have been highlighted as well as the ones in common between two or three conditions. (B) Shotgun proteomic analyses of proteins issued from bone marrow Stem cells conditioned medium collected at 14 h, 24 h, and 48 h. Representative heatmap of the common proteins and quantified by label free and analyses by MaxQuant with a p value = 0.01.

