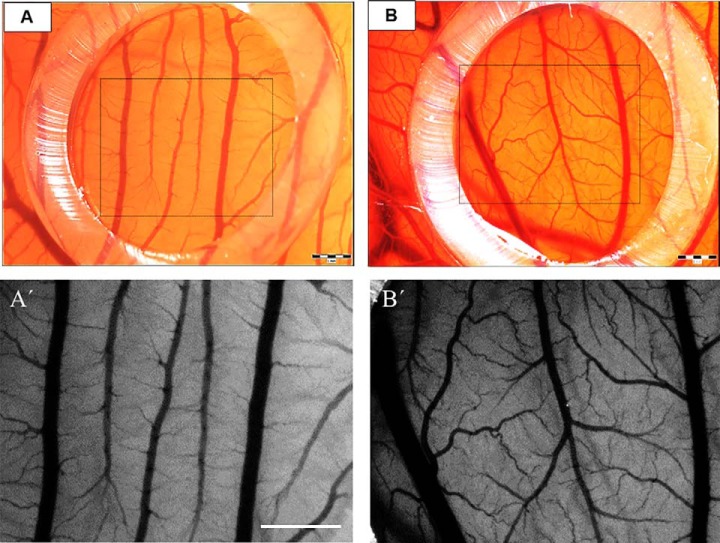
Fig. 5.
The angiogenic profile in CAM assay exposed to DMEM (A, A′) and BMMSC CM (B, B′) at 72 h. Note the enhanced density of vessels in the angiogenesis zone (outlined boxed area in A, B) treated with BMMSC CM when compared with DMEM. Detail of numerous vessels and bifurcations in higher magnification (A′) compared with control (B′). Scale bars = 1 mm (A, A′, B, B′).

