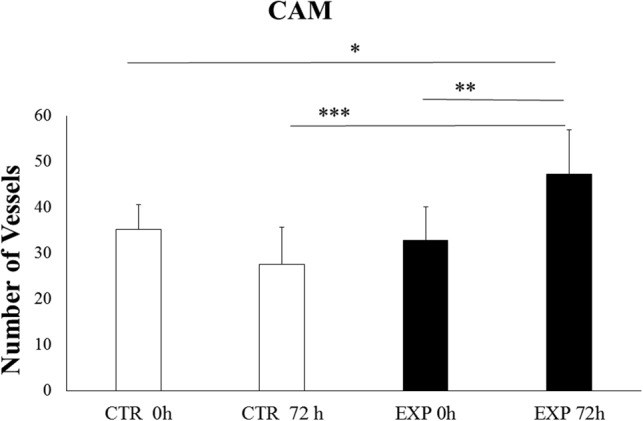
Fig. 6.

Quantification of vessels in CAM assay exposed to DMEM (A, A′) and BMMSC CM (B, B′) at 0 h and 72h. Mean values among different groups were statistically compared by one-way ANOVA and Tukey's post hock tests, with a p value = 0.05. CTR 0 h versus EXP 72 h (*p value of < 0.05); EXP 0 h versus EXP 72 h (**p value of < 0.01) and CTR 72 h versus EXP 72 h (***p < 0.001).
