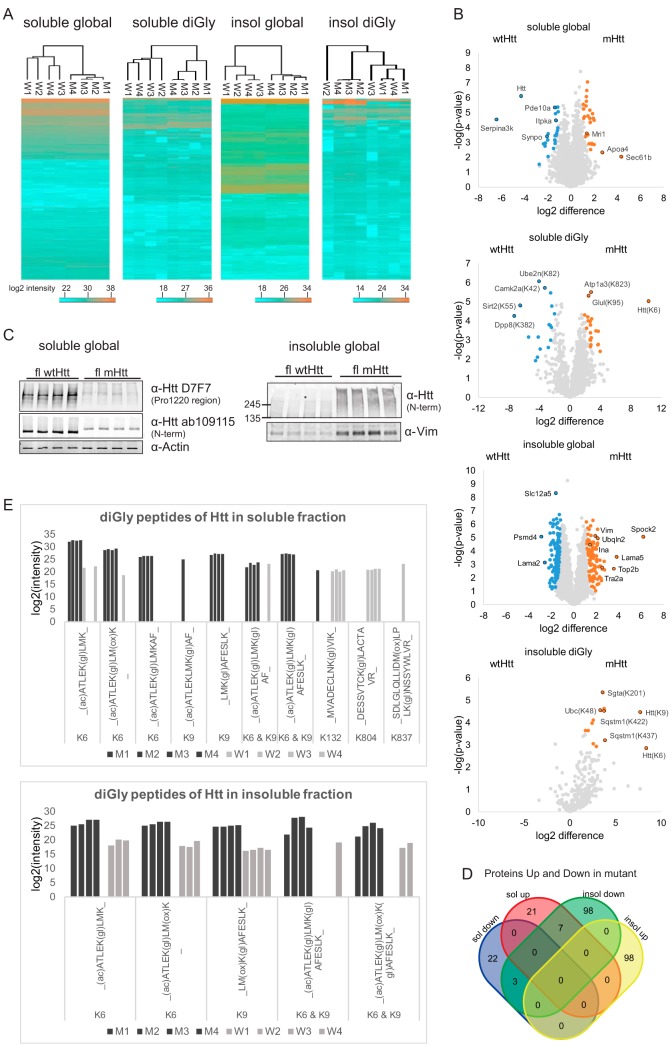
Fig. 2.
Visualization of quantitative data. A, Heatmaps (Euclidian Distance) of log2 transformed LFQ intensities of identified and quantified proteins and diGly sites for all data sets. Lowest intensities are shown in blue and highest intensities are shown in orange. B, Volcano plots showing protein or diGly site relative abundances for all data sets. Orange: proteins/diGly sites up in mutant Htt mice brain; blue: proteins/diGly sites up in wtHtt mice brain. C, SDS-PAGE and Western blot analysis of the quadruplicate wtHtt and mHtt brain lysates with antibodies against both Htt Proline 1220 region and N terminus and actin (loading control) confirm decreased Htt protein levels in mHtt mice brain in the soluble global proteome. SDS-PAGE and Western blot analysis of the quadruplicate wtHtt and mHtt brain lysates with an antibody against Vimentin confirms increased Vimentin protein levels in mHtt mice brain in the insoluble global proteome. Full-length (and probably fragments of) Htt was detected with the antibody raised against Htt N terminus only in mHtt insoluble fractions. D, Venn diagram showing number of proteins that were significantly up and down in soluble and insoluble fractions. Only the proteins that pass the fold change and p value threshold in the t test (those marked in color in the volcano plots) are shown. E, The bar plots showing the log2 intensities of the diGly peptides of the Huntingtin protein in soluble and insoluble fractions. The intensities are the raw intensities from the MaxQuant evidence file. Modified sequences that have a C-term diGly are excluded.

