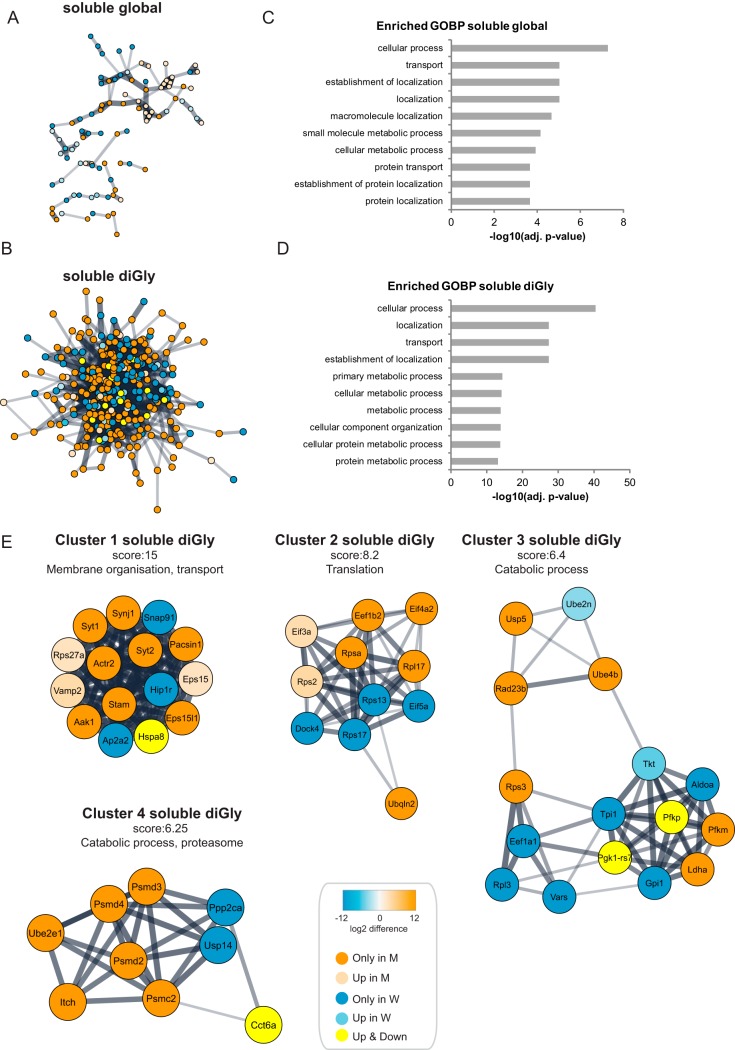
Fig. 3.
Functional analysis of Huntington's disease dependent changes in the global proteome and ubiquitinome of the soluble fractions of Q175FDN mouse brain lysates. A, STRING network analysis was performed on differentially expressed proteins in the soluble fraction. Orange is used for proteins identified exclusively in the mutant Htt samples (identified in 4 mutant samples and in 0 or 1 wild-type sample), whereas blue is used for proteins identified exclusively in wild-type samples (identified in 4 wild-type samples and in 0 or 1 mutant sample). A color gradient representing the protein fold change of orange (for upregulation in mutant) and blue (for upregulation in wild type) is used for significantly differentially expressed proteins (identified in at least 3 out of 4 mutant and wild-type samples, significant proteins in volcano plots Fig. 2B). B, Same as in Fig. 3A, but for diGly sites. Proteins of diGly sites upregulated in both wild-type and mutant samples are shown in yellow. C, Gene Ontology (GO) analysis of differentially expressed proteins in the global proteome of the soluble fraction. Top ten of enriched Biological Processes is shown, enrichment probability is represented by -log10 Benjamini Hochberg adjusted p value. D, Gene Ontology (GO) analysis of differentially expressed diGly sites in the soluble fraction. Top ten of enriched Biological Processes is shown, enrichment probability is represented by -log10 Benjamini Hochberg score. E, Cytoscape plugin MCODE revealed highly interconnected clusters in the STRING network of the differentially expressed diGly sites in the soluble fraction. Clusters with highest scores are shown here. See A and B for description of node color coding.

