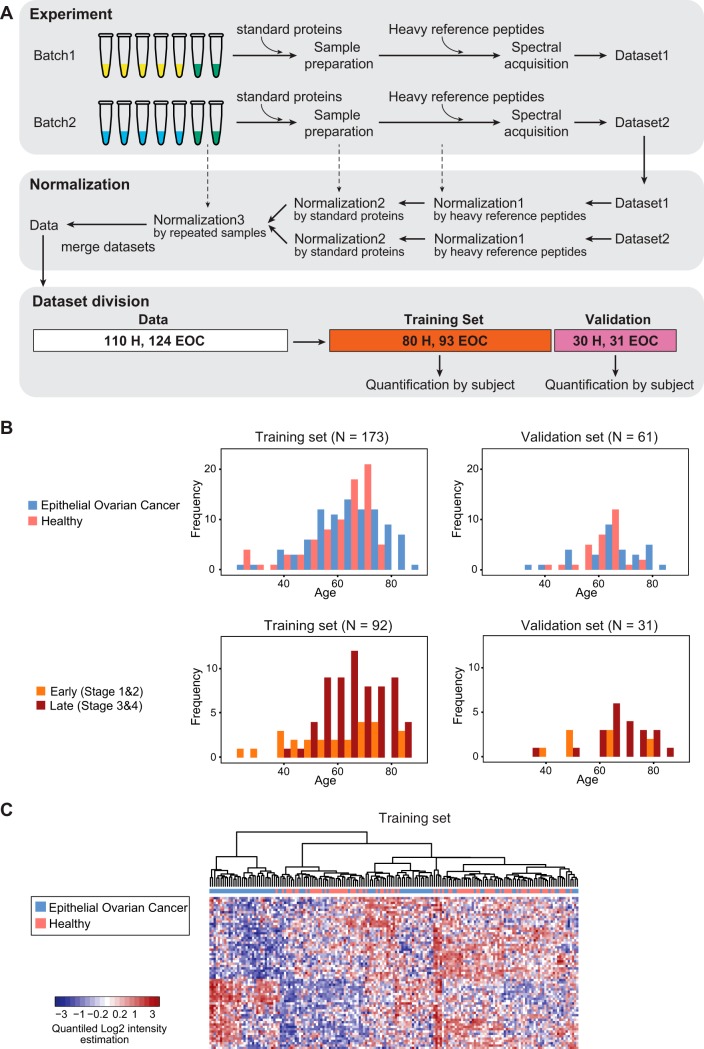
Fig. 3.
Experimental design for SRM-based evaluation of biomarker candidates in a large EOC patient cohort. A, Overview of the experimental design. The repeated samples of 38 subjects (green tubes), two standard proteins, and heavy reference peptides were used as controls in multiple steps of experiments. The subject samples were processed and measured in two batches. Three normalization steps were applied to combine the datasets derived from two batches, thereby accounting for variability in instrument performance, variability in sample preparation, and other batch effects. The merged normalized dataset from both batches was divided into a training set and a validation set. Feature intensities were summarized into protein abundances for each subject, separately for the training set and the validation set. B, Distribution of subjects across the training and the validation sets based on confounding factors, age and stage of EOC. C, Heatmap of standardized protein abundances of 65 proteins across all the subjects in the training set. The subjects are arranged in columns, and the proteins in rows. For the purposes of visual display, the summarized protein abundances were standardized by protein (i.e. by row) on a quantile scale. Red shades indicate increased protein abundance, and blue shades indicate reduced protein abundance. Hierarchical clustering with Euclidian distance and Ward linkage was employed to cluster subjects by similarity of standardized protein abundance. The disease status of subjects is labeled with green for healthy cases, yellow for EOC cases at the top of heatmap.

