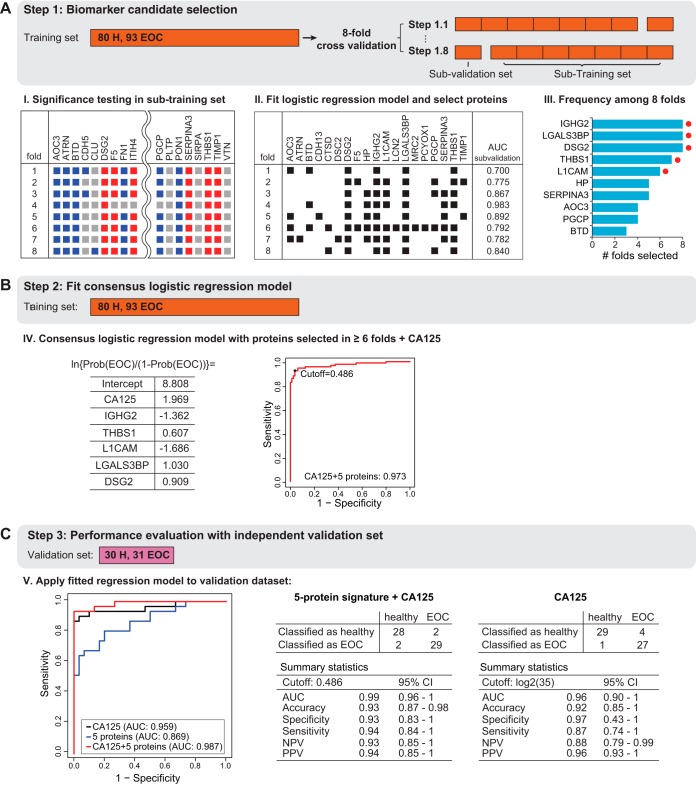
Fig. 4.
Protein biomarker signature development. A, The training set was used to determine a predictive biomarker signature using multivariate logistic regression and 8-fold cross-validation. The subjects were systematically rotated between eight folds. Within each fold, differentially abundant proteins were determined comparing EOC patients to healthy controls. The plot indicates the results per fold. Red squares indicate significantly up-regulated proteins, and blue squares indicate significantly down-regulated significant protein. Gray color indicates no statistically significant changes (fold change cutoff ±1.1, adjusted p value < 0.05). Next, a logistic regression model was fit with stepwise method for selecting predictive proteins (black squares show the selected proteins for each fold) and the disease status was predicted for the 'left-out' subjects in each fold (AUC sub-validation). The final consensus logistic regression model was generated using the biomarker candidates selected more than six times among eight folds in the cross validation (selected proteins are indicated with a red dot). B, The consensus logistic regression model was fit in the training set, combining the selected biomarker candidates with CA125. The probability cutoff was selected to maximize the predictive accuracy on the training set. C, The validation set was used to evaluate the performance of the final consensus logistic regression model. Detection of disease status of subjects with EOC and healthy controls was summarized in an ROC curve comparing CA125 to the novel five-protein signature and its combination with CA125. Summary statistics are listed for five-protein signature plus CA125 and CA125 alone.

