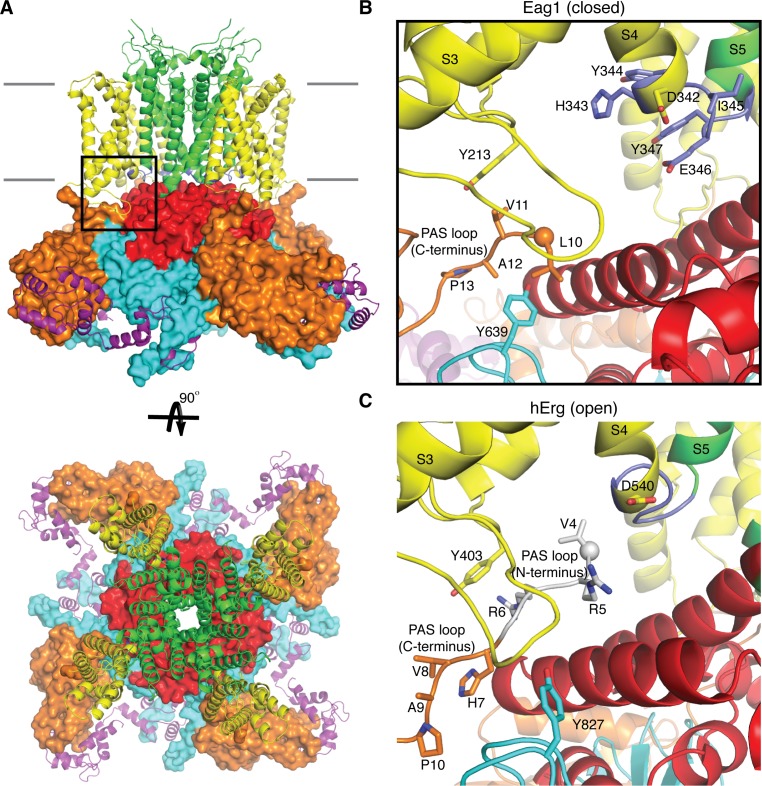
Figure 1. Comparison of the PAS loop in Eag1 and hErg.
(A) Structure of Eag1 (PDB: 5K7L) in the closed conformation (PAS is orange, VS is yellow, S4-S5 linker is blue, pore is green, C-linker is red, CNBHD is cyan, CaM is purple, and membrane is indicated by gray bars) with a black box indicating the view for panel (B). (B) View of interaction between PAS loop, VS and CNBHD in the closed conformation of Eag1 with the same coloring as in (A). The N-terminus of the protein is shown as a sphere. The PAS loop N-terminus is not observed in this structure. (C) View of the interaction between PAS loop, VS and CNBHD in the open conformation of hErg (PDB: 5VA2) with the same coloring and orientation as in (B). The N-terminus is shown as a sphere and the PAS loop N-terminus is shown in gray.

