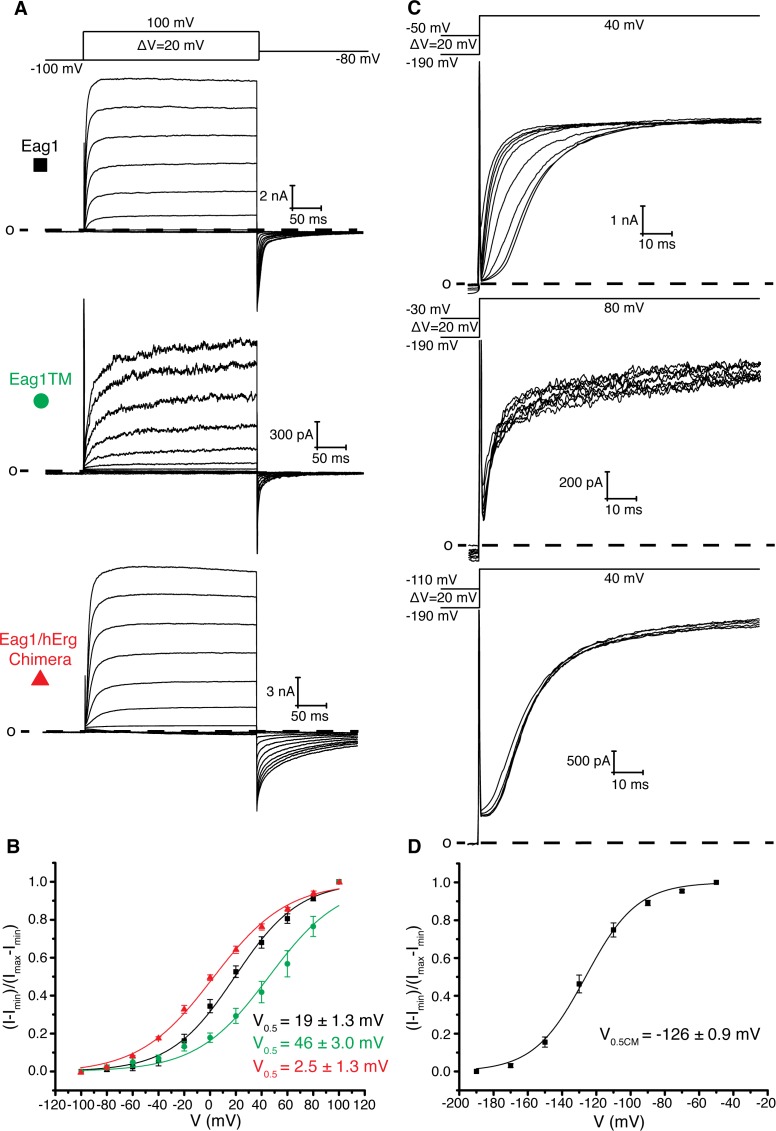
Figure 2. Role of intracellular domains in voltage-dependent gating.
(A) Voltage family current trace of WT Eag1, Eag1TM, and the Eag1/hErg chimera with the voltage-pulse protocol shown above. (B) Normalized tail current vs. depolarization voltage plot for WT Eag1 (black square, n = 6), Eag1TM (green circle, n = 4), and the Eag1/hErg chimera (red triangle, n = 4) with V0.5 values (mean ± sd). Eag1TM did not reach saturation up to 100 mV. (C) Cole-Moore effect of WT Eag1, Eag1TM, and the Eag1/hErg chimera with the voltage-pulse protocol shown above. (D) Plot of normalized current at 10 ms following the depolarization step vs holding potential for WT Eag1 (Cole-Moore I-V plot). The Cole-Moore I-V plot was fit with a Boltzmann function to estimate the holding potential that produces half maximal rates of activation (V0.5CM = −126 ± 0.9 mV, mean ± sd, n = 6).

