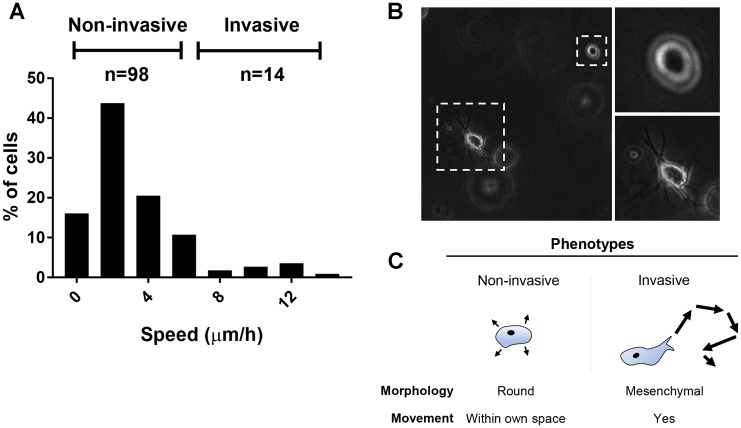
Figure 4. Migration and invasive potential of ciPTEC-OAT1.
(A) Histogram showing the average speed (μm/h) at which the cells moved through Matrigel™ basement membrane matrix during the 24 h time-lapse imaging. Obtained values arose from 112 cells analyzed from two independent experiments. (B) Representative pictures showing morphological differences between the invasive and non-invasive phenotypes (20× magnification). (C) Invasive cells displayed mesenchymal cell-like movement, while non-invasive cells were round and static, wobbled only within their own space.

