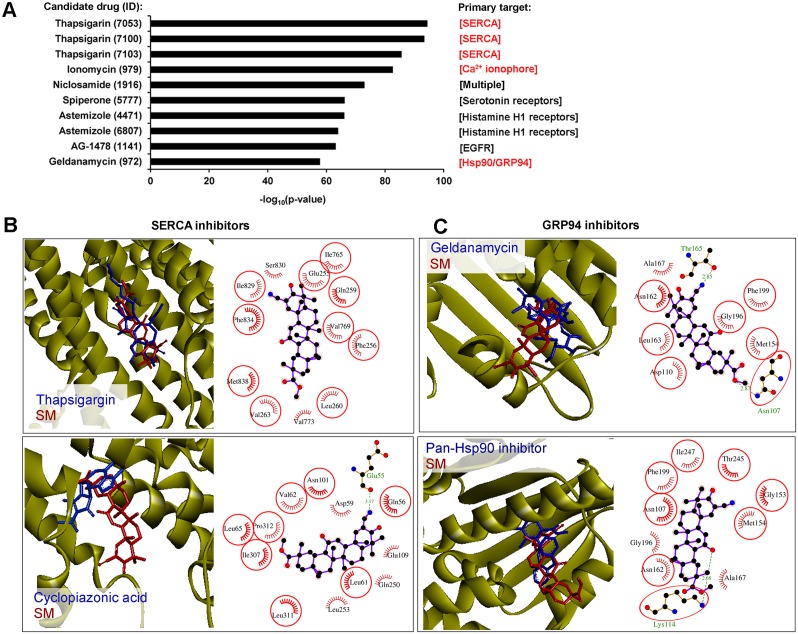
Figure 8. SERCA and GRP94 could be considered as probable direct targets of SM.
(A) CMap analysis found a strong similarity between the SM-induced gene expression signature and those induced by known ER stress activators. The diagram shows the Top 10 candidate drugs from CMap analysis that displayed similar effects on the transcriptome of tumor cells to that of SM. Primary targets of the drugs, dysregulation of which caused ER stress, are marked in red. CMap analysis performed on ToppGene Suite (https://toppgene.cchmc.org), up- and down-regulated DEGs (fold change > 1.5), identified in KB-3-1 treated by SM for 10 h, were used as the input query. (B) The mode of binding of SM to SERCA. Stereo presentation of docked poses of SM in SERCA, superimposed on thapsigargin and cyclopiazonic acid-bound structures (PDB IDs: 2AGV and 1OA0, respectively), was drawn by BIOVIA Discovery Studio. Structures of SERCA inhibitors and SM are depicted by blue and red sticks, respectively. 2D representation of docked poses of SM in SERCA is created by LigPlot+. The combs and green dashed lines represent hydrophobic interactions and hydrogen bonds, respectively. Common residues, interacting with both inhibitors and SM, are highlighted in red circles. Color coding of atoms in ball format: black – carbon, blue – nitrogen and red – oxygen. (C) The mode of binding of SM to GRP94. Stereo presentation of docked poses of SM in GRP94, superimposed on geldanamycin and methyl 2-[2-(2-benzylpyridin-3-yl) ethyl]-3-chloro-4,6-dihydroxybenzoate (Pan-Hsp90 inhibitor)-bound structures (PDB IDs: 2EXL and 6ASQ, respectively), were drawn by BIOVIA Discovery Studio. Structures of GRP94 inhibitors and SM are depicted by blue and red sticks, respectively. The 2D representation of docked poses of SM in GRP94 was created by LigPlot+.

