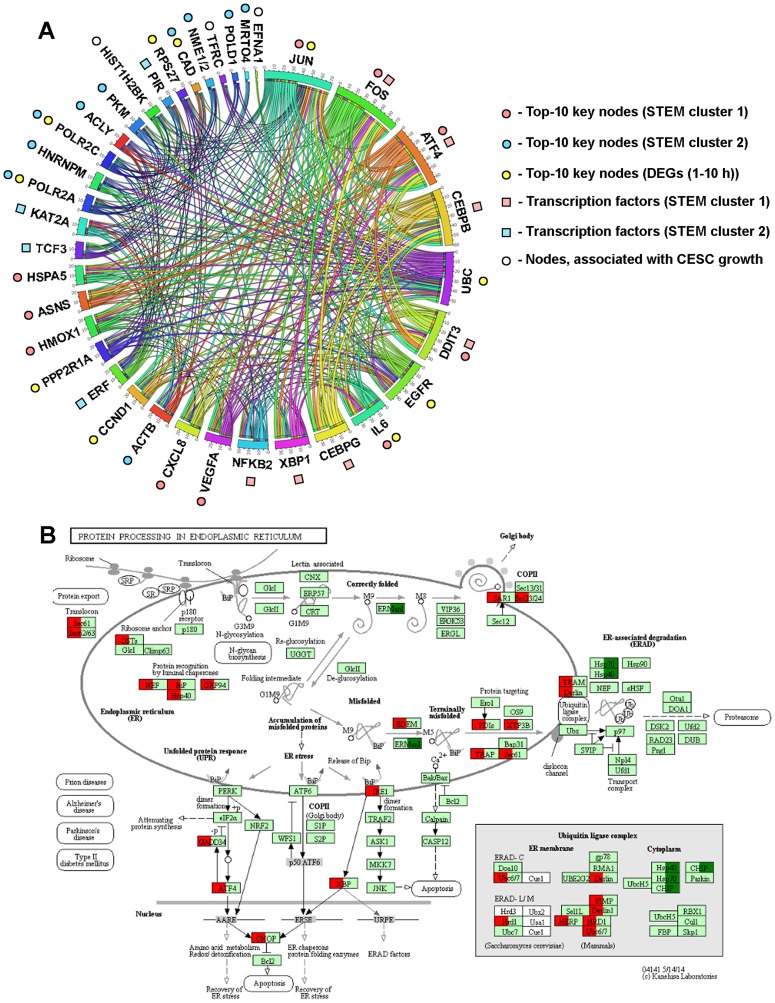
Figure 9. Dysregulation of ER homeostasis is a central event triggered by SM in KB-3-1 cells.
(A) Interactome of MRs likely controlling the response of KB-3-1 cells to SM treatment. The regulatory network reconstructed with MRs was identified by different approaches during the study. Edges were retrieved by Cytoscape from STRING (confidence score > 0.7), UniProt, InnateDB, MINT and Mentha databases and regulatory interactions, revealed by promotor analysis of DEGs by using TRANSFAC, Jaspar, Encode, Swissregulon and Homer databases. The revealed interactome was visualized via Circos (http://mkweb.bcgsc.ca/tableviewer/). (B) The effect of SM treatment (10 h) on the expression of genes involved in the regulation of ER stress. Red and green colors show up- and down-regulated genes (fold change > 1.5, p < 0.05), respectively. Expression data was overlaid on the KEGG pathway 04141 via KeggExp (http://www.fgvis.com/expressvis/KeggExp/).

