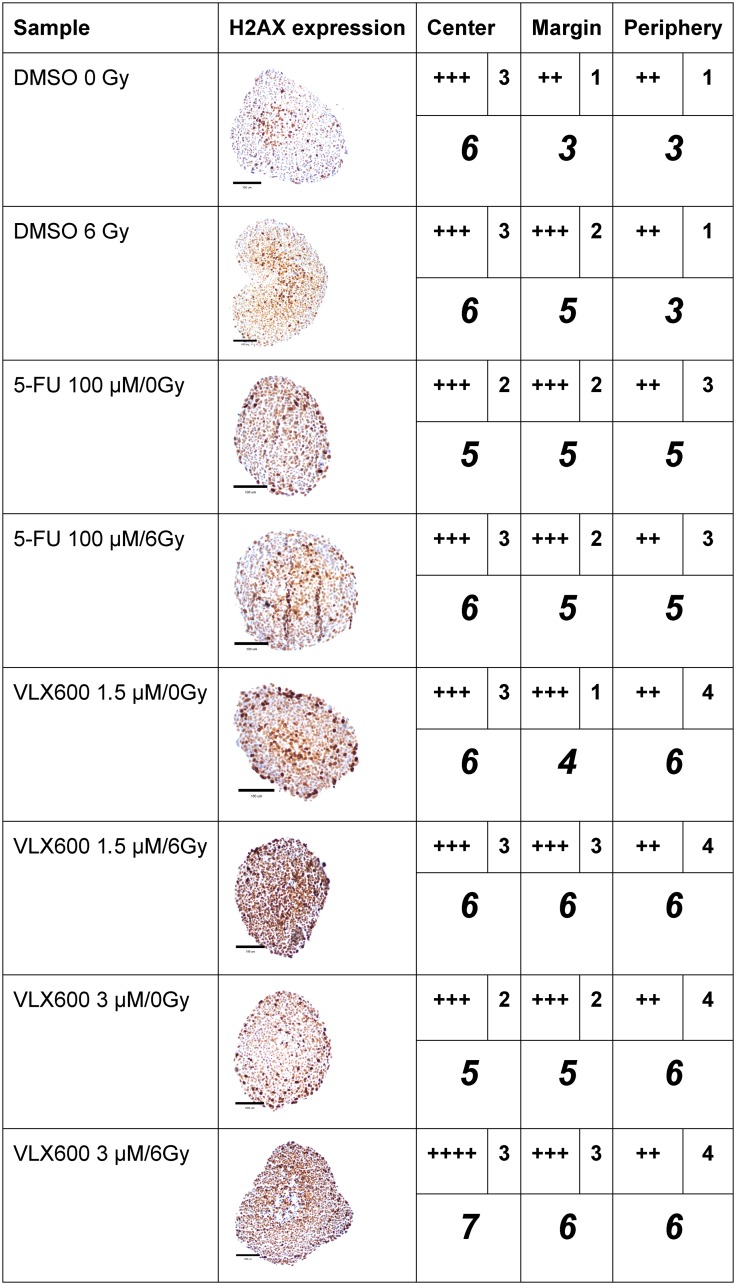
Figure 3. Immunohistochemical expression (centrally and peripherally in spheroids) of gamma-H2AX in HCT116 GFP cells cultured as spheroids for 7 days, then irradiated (6 Gy) at 4–6 h after addition of drug and harvested 24 h later.
A typical expression pattern from each sample is shown in the second column. A light microscope at 400x magnification was used to assess immunohistochemical staining. H2A.X was scored as no expression (-), expression in 1–25% of cells (+), 26–50% of cells (++), 51–75% of cells (+++) and 76–100% of cells (++++) in the center, margin (between the center and periphery) or periphery. The intensity of the staining in each location was scored as 1 (low), 2 (moderate), 3 (high) or 4 (very high). The number of plus signs was added to the intensity number to obtain a weighted measure of the staining (italicized number). The assessment was based on observation of 6–40 spheroids for each experimental condition. Scale bar = 100 μM.

