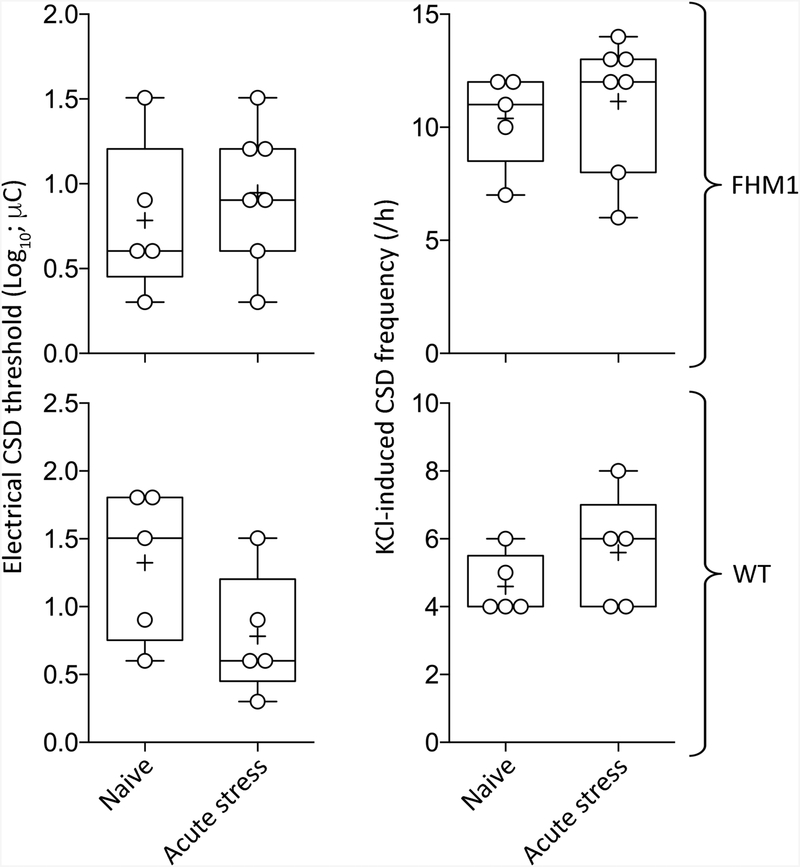
Figure 3. Acute stress.
CSD threshold (left) and frequency (right) are shown from wild-type (WT) and FHM1 mutant mice (whiskers, full range; box, interquartile range; line, median, +, mean). Individual data points are also shown. All animals were female. There was no statistically significant difference (two-way ANOVA, stress status and genotype as independent variables.

