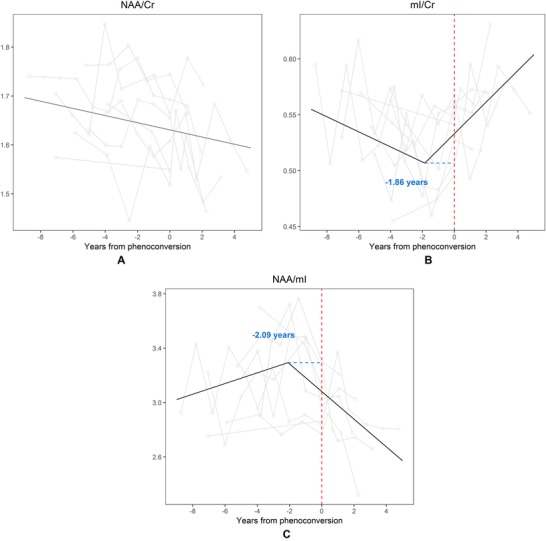
Figure 1.

The flex point model for 1H MRS metabolite ratios. In the x axis, 0 indicates the actual age of symptom onset for converters with MAPT mutation. The metabolite ratios are in the y axis. The black line shows the predicted values calculated from the flex‐point models. NAA/Cr ratios did not have a “flex‐point” during the follow‐up time window (A). The increase of the presumed glial marker mI/Cr accelerated in 1.86 years prior to symptom onset, and continued to increase in time (B). A similar trajectory of decrease was observed the neuronal marker NAA/mI ratio 2.09 years prior to symptom onset (C). NAA = N‐acetylaspartate; Cr = creatine; mI = myo‐inositol.
