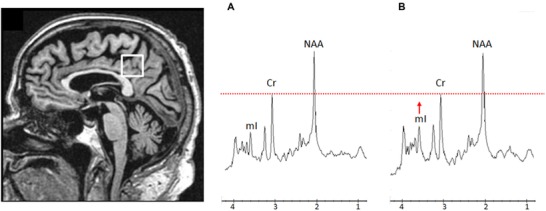
Figure 2.

Voxel location and representative 1H magnetic resonance spectra from a converter with MAPT mutation. Posterior cingulate voxel is placed on a mid‐sagittal 3‐dimensional T1‐weighted image (left). Example of 1H MRS for a converter with MAPT mutation at 2 years before symptom onset (A) and 2 year after symptom onset (B). The spectra are scaled to the creatine (Cr) peak as indicated with the dotted red line. During follow‐up, the myoinositol (mI) peak is elevated from 2 years before symptom onset with mI/Cr ratio of .48 (A) to 2 years after symptom onset with mI/Cr ratio of .57 (B). NAA = N‐acetylaspartate.
