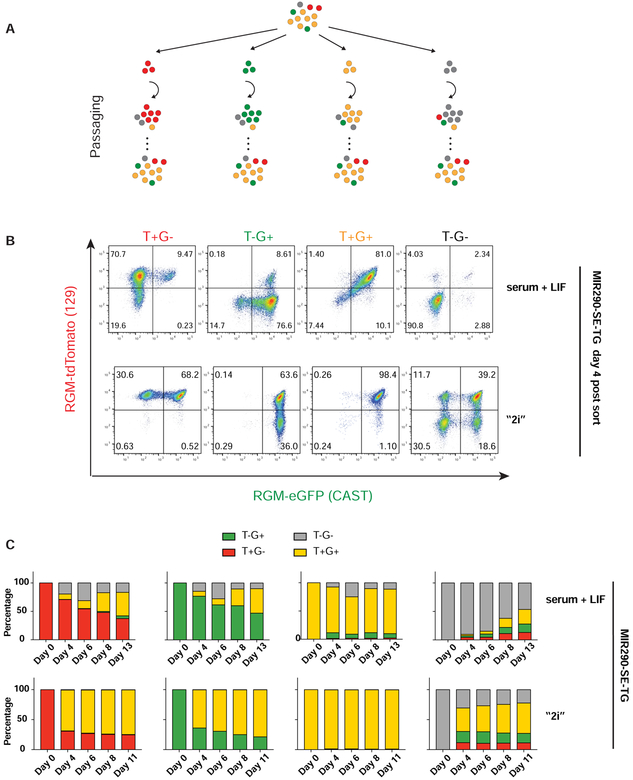
Figure 2. SE DNA methylation heterogeneity is created by dynamic switching of methylation states.
(A) Experiment setup for monitoring SE DNA methylation dynamics. Yellow cells: T+G+; grey cells: T−G−; red cells: T+G−; green cells: T−G+. (B) FACS analyses on the dynamics of T+G−, T−G+, T+G+ and T−G− populations 4 days post-sorting for both MIR290-SE-TG in serum + LIF or “2i” medium. (C) Quantifications of the dynamics of 4 sorted populations from MIR290-SE-TG in percentages change over time when cultured in the serum + LIF or the “2i” medium after sorting. See also Figure S2.

