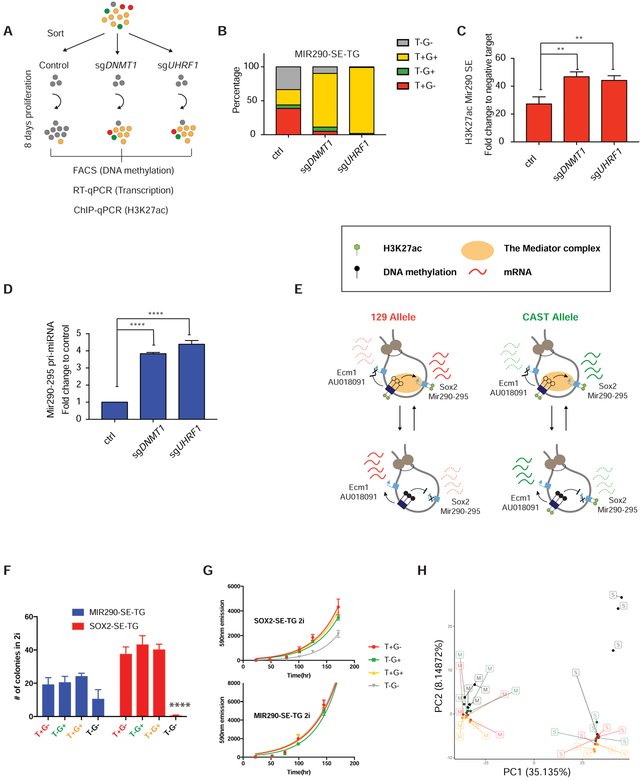
Figure 6. DNA methylation directly suppresses SE activity and affects ES cell state.
(A) Experimental setup for assessing the causal role of SE DNA methylation suppresses H3K27ac. FACS (DNA methylation), RT-qPCR (Mir290–295) and ChIP-qPCR (H3K27ac) were co-assessed from the same pool of cells from each sample. (B) Loss of DNA methylation in MIR290-SE-TG T−G− cells 8 days post Dnmt1 and Uhrf1 sgRNA transfection as compared to controls. (C) H3K27ac ChIP-qPCR at the Mir290 SE from the experimental groups in (B), respectively. Data are represented as mean ± SD. (D). Mir290–295 pri-miRNA level from the experimental groups in (B). Data are represented as mean ± SD. (E) Summary of the dynamic regulation and functional impact of allelic SE methylation. (F) Colony formation assays in “2i” starting from 100 sorted cells. Data are represented as mean ± SD. (G) Growth curves measured by AlamarBlue Cell Viability Reagent. Data are represented as mean ± SD. (H) Principal component analysis of the top 5% highly variable genes from different populations of SOX2-SE-TG (Labeled as S. red: T+G−, green, T−G+, black: T−G−, yellow: T+G+) and MIR290-SE-TG (Labeled as M. color code same as S). See also Figure S5, S6, S7.

