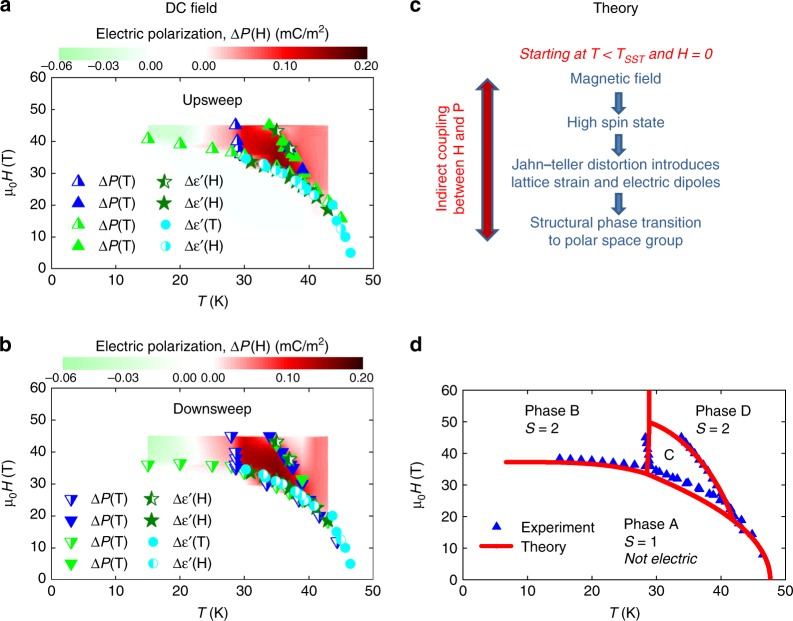
Fig. 5.
a, b Magnetic field H vs temperature T phase diagram of Mn(taa) for E || H in quasi-DC magnetic fields for up- and downsweeps. The color-mapped regions show the surface charge change relative to the low spin state. In the green region, ΔP switches sign relative to the red region. The data points in a, b are phase transitions defined as the inflection points in ΔP(H, T) and . c Outline of the magnetoelectric coupling process for creating a net electric polarization in the high spin state. d Calculated mean-field phase diagram compared to experimental data points averaged between up and downsweeps of the field. The error bars are calculated by averaging over multiple measurements and samples and are smaller than the data points

