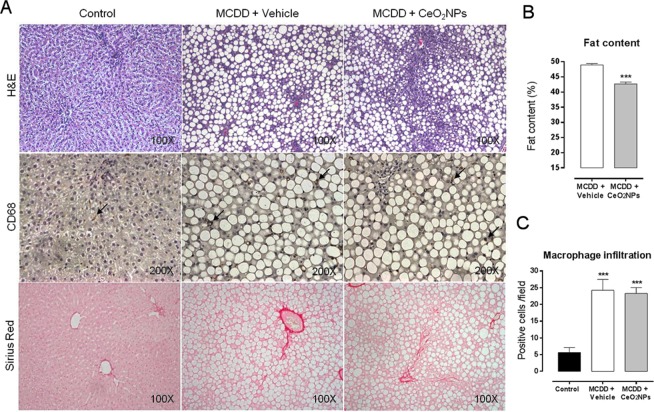
Figure 2.
Effect of CeO2NPs on hepatic histology. (A) Hematoxylin & Eosin, CD68 and Sirius Red staining of representative liver sections obtained from control rats, MCDD rats receiving vehicle and MCDD rats receiving CeO2NPs. Original magnification 100x for H&E and Sirius Red, and 200x for CD68. (B) Quantitative measurement of fat content (%) in MCDD animals. ***p < 0.001 compared to vehicle group. Unpaired Student’s t test. (C) Quantitative measurement of CD68 positive cells/field in all animals. ***p < 0.01 compared to control group. One way ANOVA with Turkey’s multiple comparison test. Results are shown as mean ± SEM.

