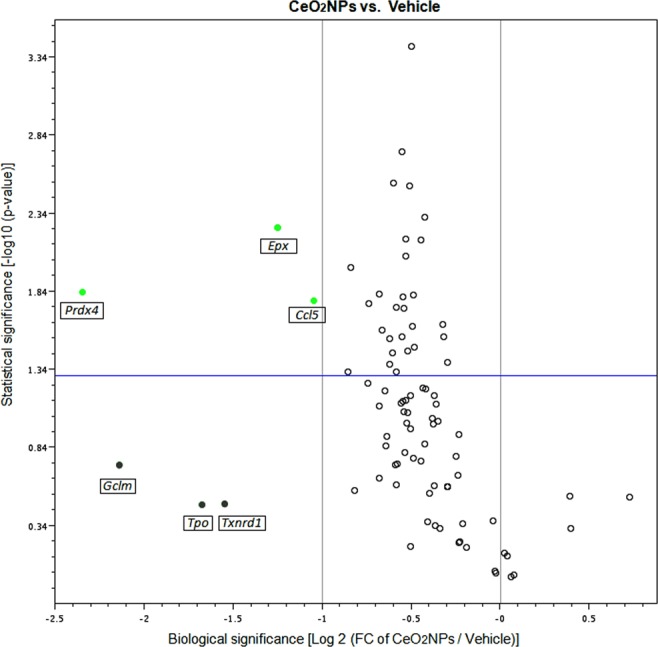
Figure 7.

A volcano plot showing the differentially expressed genes related to oxidative stress in a pair-wise comparison of vehicle- and CeO2NP-treated MCDD rats. Significances was set at a p value based on a Student’s t-test of 0.05 [−log10 (p-value) ≥ 1.30]. The biological cut-off was set at a fold regulation of ±2 fold [−1 ≥ log2 (FC of CeO2NPs/Vehicle) ≥ 1]. The top 6 differentially expressed genes are labeled with their corresponding gene ID. The different color codes used represent biologically but not statistically significant genes (grey) and both biologically and statistically significant down-regulated (green) genes, in CeO2NP treated rats.
