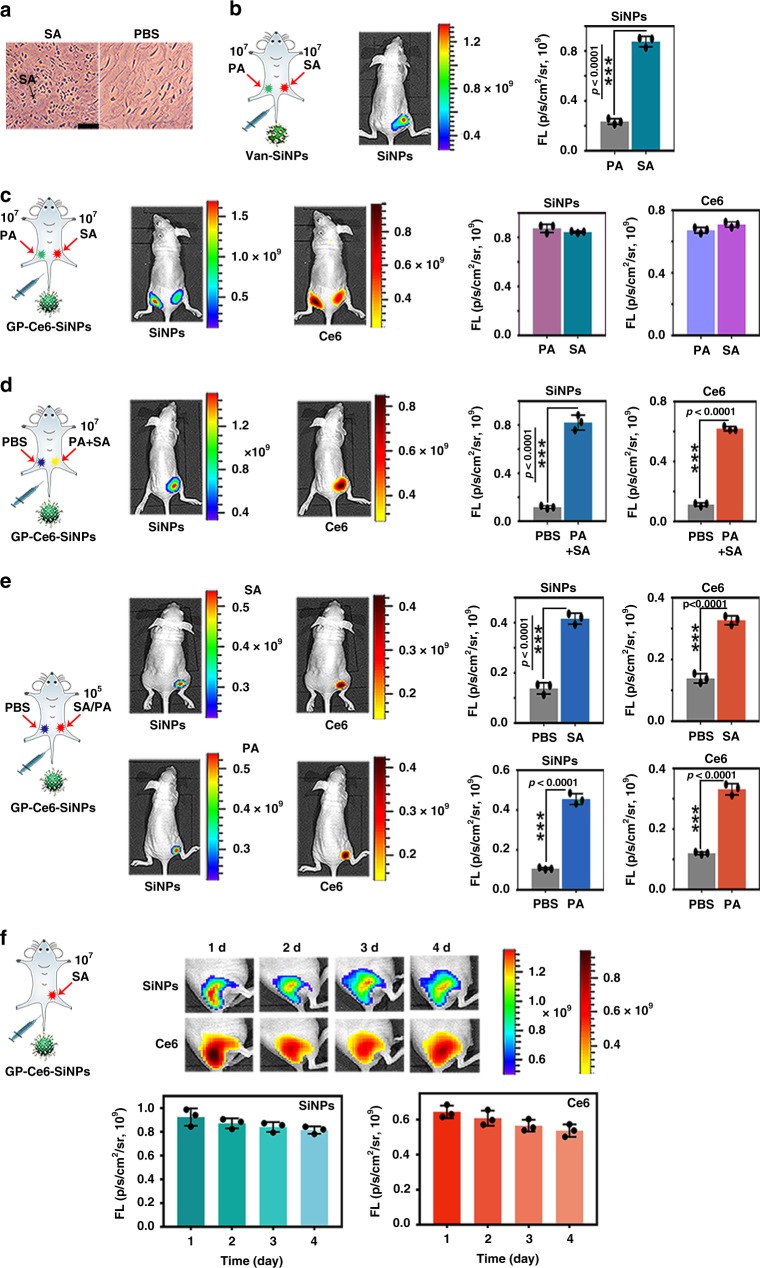
Fig. 4.
In vivo imaging of infections caused by Gram-negative and Gram-positive bacteria. a Micrograph of the histology of 1.0 × 10⁷ CFU of SA-infected and PBS-treated muscles. Scale bar: 50 μm. b In vivo imaging of 1.0 × 10⁷ CFU of SA (right side) and 1.0 × 10⁷ CFU of PA (left side)-infected sites of mice treated with Van-SiNPs and corresponding histograms of fluorescence intensity at two sites. c In vivo dual-emission imaging of 1.0 × 10⁷ CFU of SA (right side) and 1.0 × 10⁷ CFU of PA (left side)-infected sites of mice treated with GP-Ce6-SiNPs and corresponding histograms of fluorescence intensity at two sites. d In vivo dual-emission imaging of 1.0 × 10⁷ CFU of mixture of PA and SA (PA + SA, right side) and PBS (left side)-treated sites of mice injected with GP-Ce6-SiNPs and corresponding histograms of fluorescence intensity at two sites. e In vivo dual-emission imaging of 1.0 × 10⁵ CFU of SA or PA (right side) and PBS (left side)-treated sites of mice injected with GP-Ce6-SiNPs and corresponding histograms of fluorescence intensity at two sites. f Long-term in vivo dual-emission imaging of 1.0 × 10⁷ CFU of SA-infected site of mice injected with GP-Ce6-SiNPs and corresponding time-dependent histograms of fluorescence intensity. The amount of bacteria at the infection site during imaging is determined via tissue harvesting, homogenization and culturing with CFU count. Statistical analysis was performed using paired two-tailed t-test. Error bars represent the standard deviation obtained from three independent measurements (***p < 0.001, n = 3). The number (n) of mice in each experiment is 3, the total number is 18, and the gender of all mice is female. The cartoons are created by Dr. Houyu Wang. Source data are provided as a Source Data file

