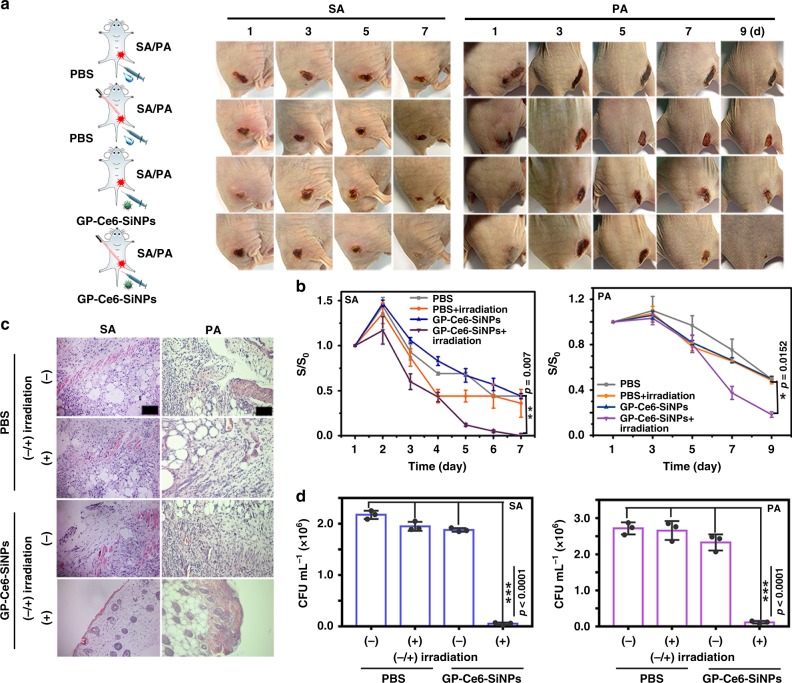
Fig. 6.
In vivo antibacterial activity of GP-Ce6-SiNPs. a Representative photographs of time-dependent of SA- and PA-infected mice injected with GP-Ce6-SiNPs or PBS treated with or without light irradiation (660 nm, 12 mW cm−2) for constant 40 min. The cartoons are created by Dr. Houyu Wang. b Corresponding time-dependent relative wound area (S/S0) of SA- and PA-infected mice in panel (a). S0 stands for the size of infection site at 1-day treatment and S stands for the size of infection site at n-day treatment. Error bars represent the standard deviation obtained from three independent measurements. c Corresponding histological images of the SA- and PA-infected skin tissues of mice in panel (a) at the 7th (SA) and 9th day (PA) post injection. Scale bar: 100 μm. d Bacterial counts (CFU mL−1) excised from the SA- and PA-infected tissues of mice at the 7th (SA) and 9th (PA) day post injection. Statistical analysis was performed using a one-way ANOVA analysis. Error bars represent the standard deviation obtained from three independent measurements (*p < 0.05, **p < 0.01, ***p < 0.001, n = 3). The concentration of GP-Ce6-SiNPs is 10 mg mL−1 (3.6 mg mL−1 of GP and 100 μg mL−1 of Ce6). Typically, the number (n) of mice used per experiment is 3, the total number is 24, and the gender of mice is female. Source data are provided as a Source Data file

