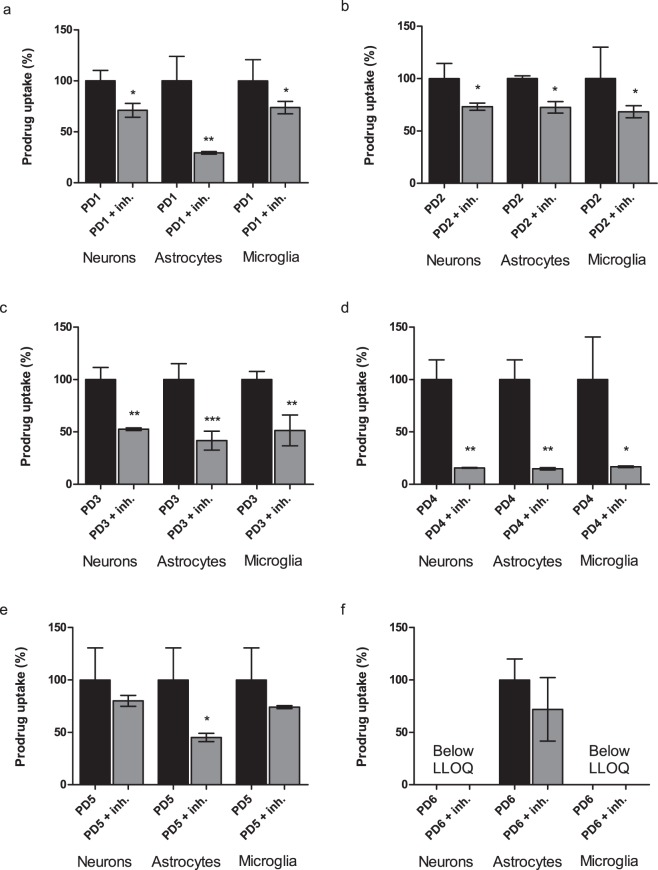
Figure 5.
(a–f) Cellular uptake of 1–10 µM prodrugs 1–6 into primary neurons and astrocytes and immortalized microglia in the absence (black bars) and the presence (grey bars) of 100 µM LAT1/Lat1-inhibitor presented as percentages (%) of prodrug uptake, in which the control (100%) is the uptake without the inhibitor. The data is presented as mean ± SD, n = 9 (*P < 0.05, **P < 0.01, one-way ANOVA, followed by Tuckey’s multiple comparison test).

