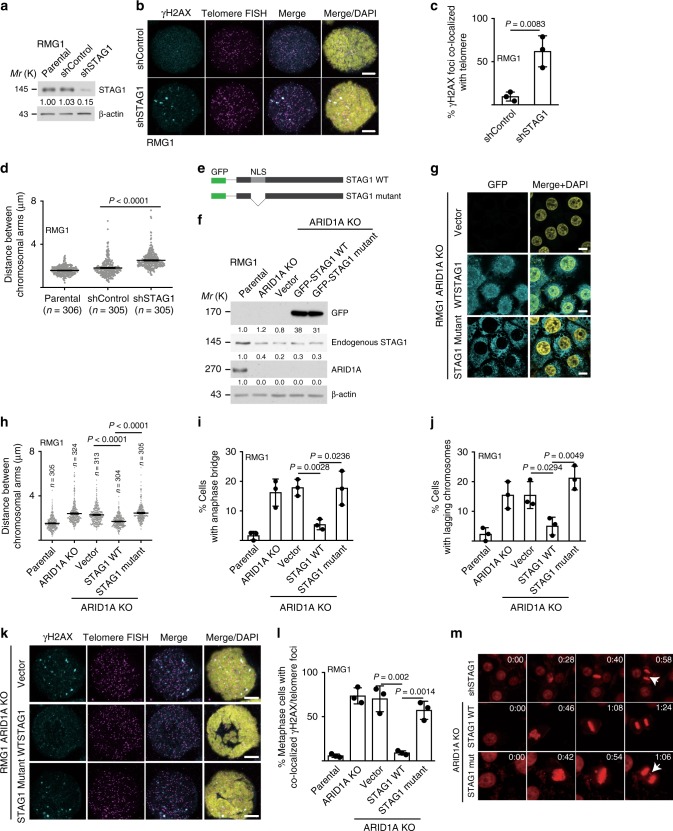
Fig. 5.
Ectopic STAG1 rescues the telomere damage and mitotic defects in ARID1A-inactivated cells. a Immunoblot validation of STAG1 knockdown in RMG1 cells. b, c Representative images (b) and quantification (c) of telomere DNA damage in RMG1 shRNA vector control and STAG1 knockdown cells determined by telomere FISH and γH2AX co-staining. d Quantification of distance between distal ends of sister chromatids enriched by colcemid treatment from the indicated RMG1 cells. e–g Schematics of STAG1 wild-type and mutant that lacks nuclear localization sequence (e), and validation of ectopic STAG1 expression by immunoblot (f) or immunofluorescence (g) in ARID1A knockout RMG1 cells. h–j Quantification of distance between distal ends of sister chromatids (h), and percentage of anaphase bridge (i) and lagging chromosome (j) positive-mitotic cells in the indicated parental, ARID1A knockout, and ARID1A knockout RMG1 cells rescued with wild-type or mutant STAG1, respectively. k, l Co-staining of telomere FISH and γH2AX (k) and quantification of telomeric DNA damage (l) in mitotic parental, ARID1A knockout, and ARID1A knockout RMG1 cells rescued with wild-type or mutant STAG1. m RMG1 cells expressing shSTAG1 or ARID1A knockout RMG1 cells rescued with wild-type or mutant STAG1 were subjected to time-lapse video microscopic analysis. Cell nuclei were visualized by staining for DNA using siR-DNA. Time is expressed as minutes: seconds. Arrows point to examples of lagging chromosomes. n = 3 independent experiments unless otherwise stated. Data represent mean ± s.e.m. Scale bar = 10 μm. P values were calculated using a two-tailed t test. Relative intensities of immunoblot bands were quantified underneath

