Fig. 6.
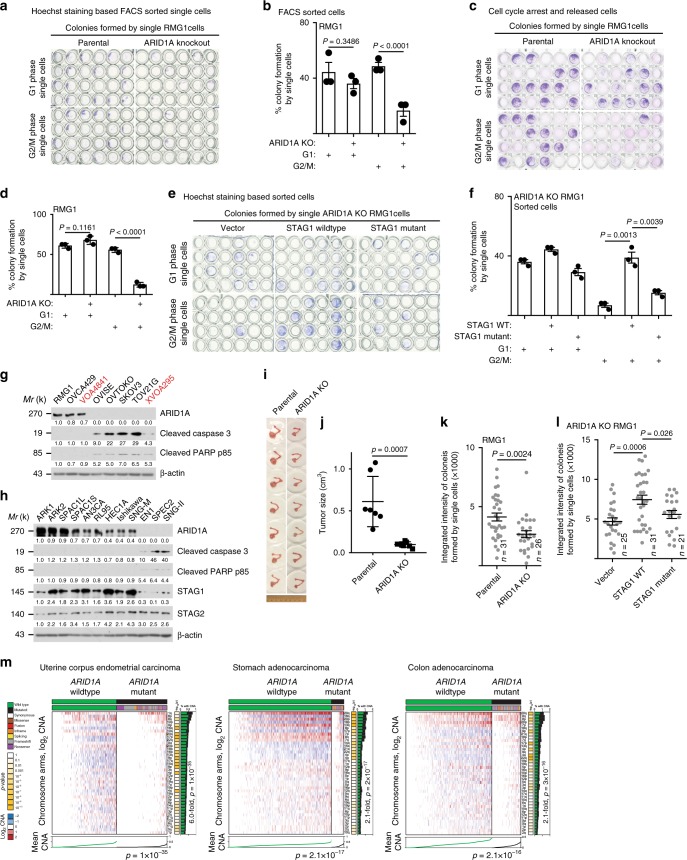
ARID1A inactivation is selective against the survival of cells during mitosis. a, b Representative images (a) and quantification of colony formation efficiency (b) of colonies formed by single parental or ARID1A knockout RMG1 cells at the indicated G1 or G2/M phases of the cell cycle sorted by flow cytometry based on Hoechst 33342 staining. c, d Representative images (c) and quantification of colony formation efficiency (d) of colonies formed by single parental or ARID1A knockout RMG1 cells at the indicated synchronized G1 or G2/M phases of the cell cycle. e, f Representative images (e) and quantification of colony formation efficiency (f) of colonies formed by single ARID1A knockout RMG1 cells rescued with wild-type or mutant STAG1 at the indicated G1 or G2/M phases of the cell cycle sorted by flow cytometry based on Hoechst 33342 staining. g, h Expression of ARID1A and apoptosis markers cleaved caspase 3 or cleaved PAPR p85 in a panel of clear cell ovarian cancer cell lines (g) or endometrial cancer cell lines (h), respectively. i, j Images of orthotopic tumors formed by parental and ARID1A knockout RMG1 cells (i) and the sizes of the tumors formed were quantified (j). k, l Integrated density analysis of colonies formed by single cell G1 phase RMG1 parental and ARID1A knockout cells (k) or ARID1A knockout RMG1 cells rescued by wild-type or mutant STAG1 (l). m Compared with ARID1A wild-type tumors, ARID1A-mutated tumors exhibit a significant less copy number variations in the indicated cancer types in the TCGA datasets. n = 3 independent experiments unless otherwise stated. Data represent mean ± s.e.m. P values were calculated using a two-tailed t test except in 6 m by multilevel mixed-effects models. Relative intensities of immunoblot bands were quantified underneath

