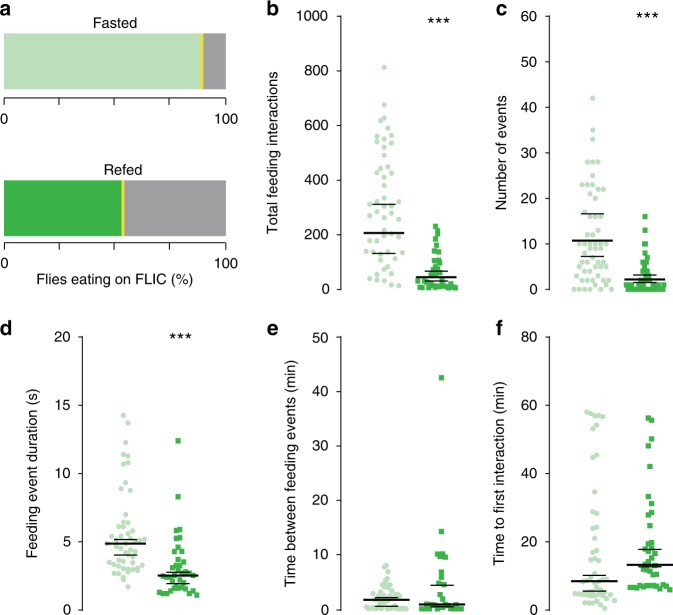
Fig. 1.
The feeding behaviors of fasted and refed flies. The feeding behavior of 24 h-fasted (light green, circles) and previously refed (darker green, squares) flies during ad-lib access to 5% sucrose on the FLIC for 1 h (See Supplementary Fig. 1 for a schematic). Individual data points are plotted in all cases. For panels b, c, which were analyzed using a Bayesian model (see Methods for details), bars show the average fitted value and the extent of a 95% credible interval; three asterisks indicate that the posterior probability from Bayesian analysis of a difference in the observed direction is greater than 0.999. For panels d–f plotted bars show a bootstrap-based median and extent of a 95% confidence interval; ***p < 0.001 using a stratified bootstrap. Fasted n = 48, refed n = 38 biologically independent animals. Source data are provided as a Source Data file. See Methods for a detailed description of the behavioral quantification and analysis. a The percentage of fasted and refed flies that interacted with food on the FLIC (green shades), compared to those that did not eat (gray shades). b–f The feeding behavior of flies during the 1-h ad-lib access to 5% sucrose quantified as b the total number of feeding interactions; c the number of feeding events (defined as five of more consecutive feeding interactions above threshold); d the mean duration (sec) among feeding events; e the mean time between 2 or more feeding events (min); f the latency to interact with food (min), calculated as the first feeding interaction initiated on the FLIC. For panels d–f, replicates with no feeding events were excluded (for panels b, c the no-interaction events are explicitly accounted for in our zero-inflated negative binomial model). Source data are provided as a Source Data file

