Fig. 2.
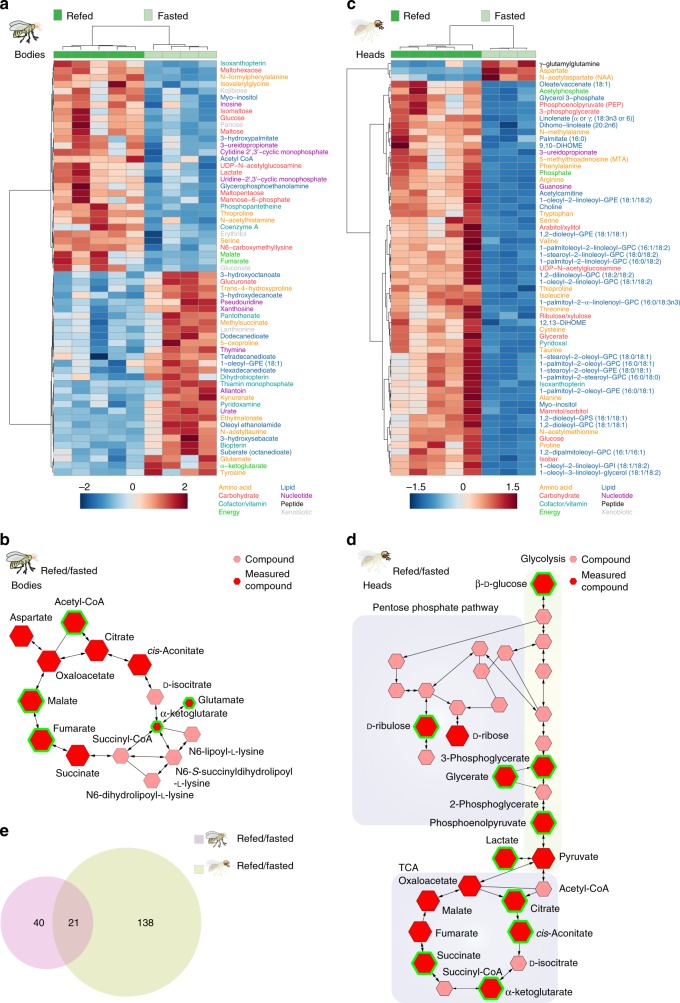
The shifts in metabolic profiles in the bodies and heads of fasted and refed flies. a Heatmap of the 61 metabolites changed in the bodies of flies between the fasted and refed conditions; Welch’s t-test, FDR < 0.1. Normalized metabolite levels were clustered by compound (rows) and biological replicate (columns). The names of metabolites are colored according to their metabolic classes (bottom). The heatmap indicates positive (red shades) and negative (blue shades) normalized compound levels. b A Flyscape network showing the changes in the TCA cycle in the bodies of refed and fasted flies. The size of the compound nodes (hexagons) reflects changes in metabolite abundance (up or down) between refed and fasted flies, salmon-colored hexagons represent compounds that were not measured, and the green outlines highlight statistically significant measurements (Welch’s t-test, FDR < 0.1). c Heatmap of the top 61 (out of 159) metabolites that change in the heads of fasted and refed flies (Welch’s t-test, FDR < 0.1). Normalized compound levels were clustered by compound (rows) and data replicate (columns). The names of metabolites are colored according to their metabolic classes (bottom). The heatmap indicates positive (red shades) and negative (blue shades) normalized compound levels. d Flyscape network showing the metabolites changing in glycolysis, pentose-phosphate pathway, and TCA cycle in refed vs. fasted fly heads. The size of the compound nodes (hexagons) reflects changes in metabolite abundance between refed and fasted flies, red and salmon-colored hexagons represent compounds that were and were not measured, respectively, and the green outlines highlight statistically significant measurements (Welch’s t-test, FDR < 0.1). e Venn diagram showing the overlap in the metabolic shifts between the bodies of fasted and refed flies (lavender shade) and heads (green shade) of flies. Welch’s t-test, FDR < 0.1. Source data are provided as a Source Data file

