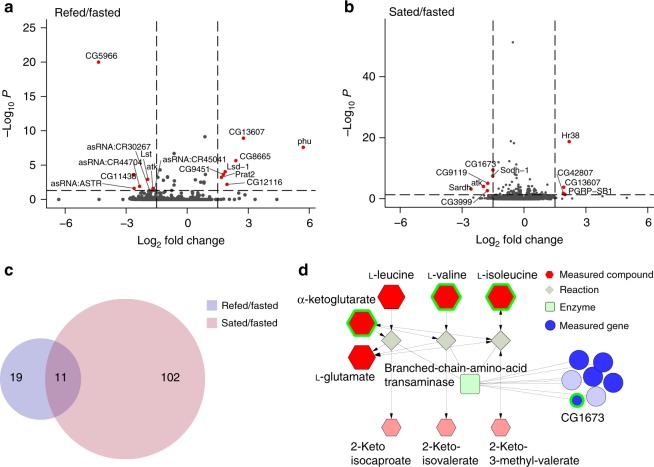
Fig. 3.
RNA abundance changes of genes involved in nutrient transport and metabolism with refeeding. a, b Volcano plots showing the significant changes (Wald test, FDR < 0.05) in transcript levels between a refed vs. fasted and b sated vs. fasted brains. See main text and Methods for details on the feeding manipulations. The horizontal dotted line defines the p-value cutoff of 0.05, and the vertical lines indicate a log2 fold change of ±1.5. Red circles indicate transcripts that pass p-value and log2 fold cutoffs. c Venn diagram showing the overlap in the transcripts that change between the refed/fasted (purple shade) and the sated/fasted (pink shade) conditions. d A partial Flyscape network made using both the metabolomics (Fig. 2) and the RNA-sequencing data (this figure) showing the metabolites and genes that change between the fasted and refed conditions in branched-chain amino acid metabolism. The size of the compound nodes (red hexagons) reflects changes in metabolite abundance (up or down) between refed and fasted flies, and salmon-colored hexagons represent compounds that were not measured. The size of the gene nodes (blue circles) represent the sign of changes in RNA abundance between fasted and refed flies, (light blue circles are genes that were not measured). Green squares represent the enzyme type. Compounds with an FDR < 0.1 by Welch’s t-test and genes with a corrected p-value < 0.05 by Wald test are outlined in green. Source data are provided as a Source Data file

