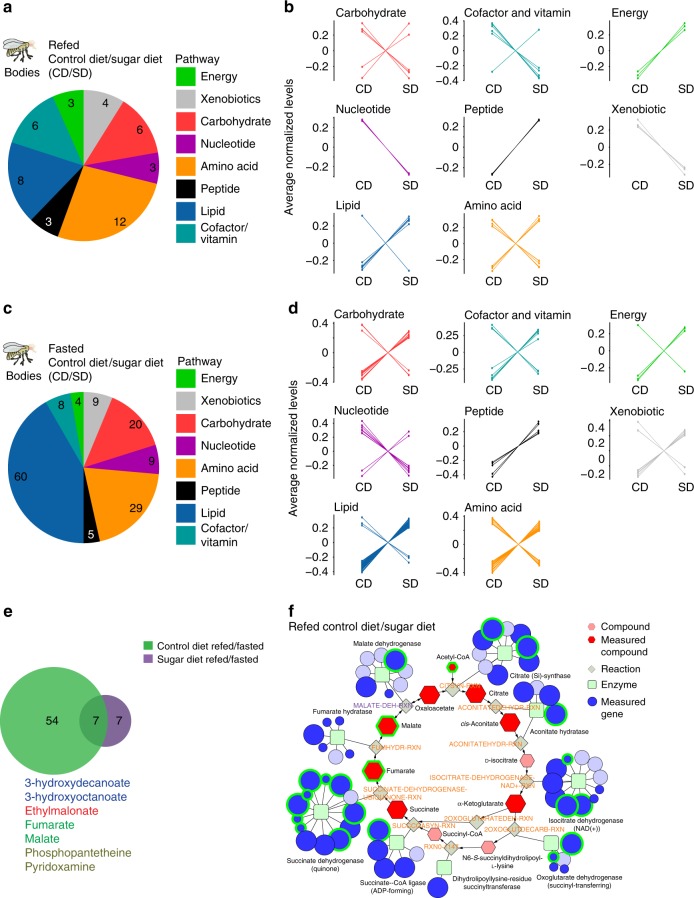
Fig. 4.
Consumption of a SD alters the metabolic profiles of fasted and refed flies. a, b The effect of a high sugar diet on the metabolite classes (labeled by different colors) in the bodies of a, b refed and c, d fasted flies. Control diet (CD) and high sugar diet (SD). Welch’s t-test, FDR < 0.1. b, d The normalized levels of the compounds, grouped by class, that differ between b the refed CD and SD fly bodies (45 compounds), and d the fasted CD and SD fly bodies (144 compounds). Color scheme defines metabolite classes listed in a. e Venn diagram showing the overlap in the metabolic compounds that change between the refed and fasted conditions in the bodies of flies fed a CD (green shade) or SD (purple shade). Metabolites shared between flies on a CD and SD are listed and colored according to class as in color scheme from a. f A Flyscape network made by using compounds changed in bodies of refed flies fed a CD or SD (panels a and b in this figure) and RNA sequencing generated by another study (see main text and methods). The size of the compound nodes (red hexagons) reflects changes in metabolite abundance (up or down) between refed and fasted flies, and salmon-colored hexagons represent compounds that were not measured. The size of the gene nodes (blue circles) represent the magnitude of change in RNA abundance between fasted and refed flies, (light blue circles are genes that were no measured). Green squares represent the enzyme. Compounds with an FDR < 0.1 by Welch’s t-test and genes with a corrected p-value < 0.05 by Wald test are outlined in green. Source data are provided as a Source Data file

