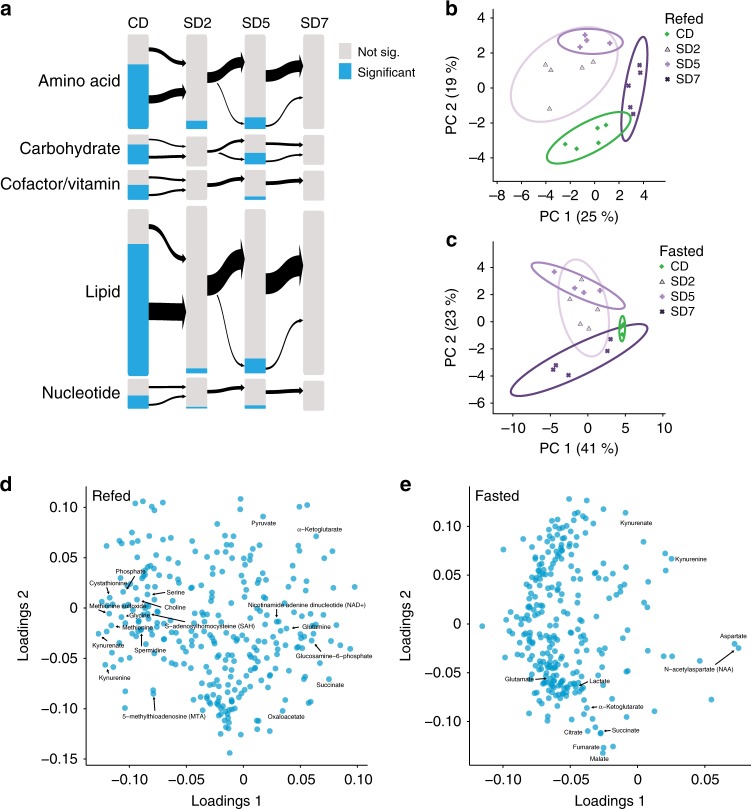
Fig. 6.
SD reshapes the metabolic transitions between hunger and satiety in fly heads. a The effects of short, (2 days, SD2), medium (5 days, SD5), and longer term (7 days, SD7) consumption of a high sugar diet (SD) compared to a control diet (CD) on the magnitude of the metabolite differences between the fasted and refed state on each diet. The size of the bars is proportional to the number of compounds in each metabolite category on the left. In blue are metabolites that were significantly different between fasted and refed flies in each condition (CD, SD2, SD5, and SD7 by Welch’s t-test, FDR < 0.1), and in gray metabolites that were not. b, c Projection onto the two most explanatory principal components for compound levels from b refed and c fasted heads of flies on CD (green) and fed a SD (purple shades) for 2 days (SD2), 5 days (SD5), or 7 days (SD7). The solid lines represent the 95% confidence interval, and percent explained variance is listed in parentheses. d, e Principal component loadings for the d refed and e fasted heads of flies fed a CD, or SD2, SD5, or SD7. Labels represent characteristic compounds. Source data are provided as a Source Data file

