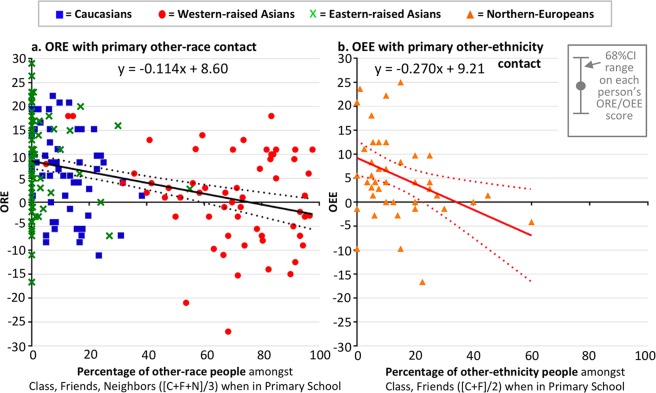
Figure 5.
Sufficient primary school contact can completely eliminate other-race and other-ethnicity effects. Plots show individual-participant scores for (a). ORE and (b). OEE. Solid trendlines (with equations) show line of best fit. Dotted lines are 95%CI on the trendline. Error bar at top right indicates approximate 68%CI on each individual participant’s ORE/OEE score (Table S6 for exact values); this illustrates that much of the variability in individual scores represents measurement error rather than variance that needs to be explained theoretically.

