Fig. 2.
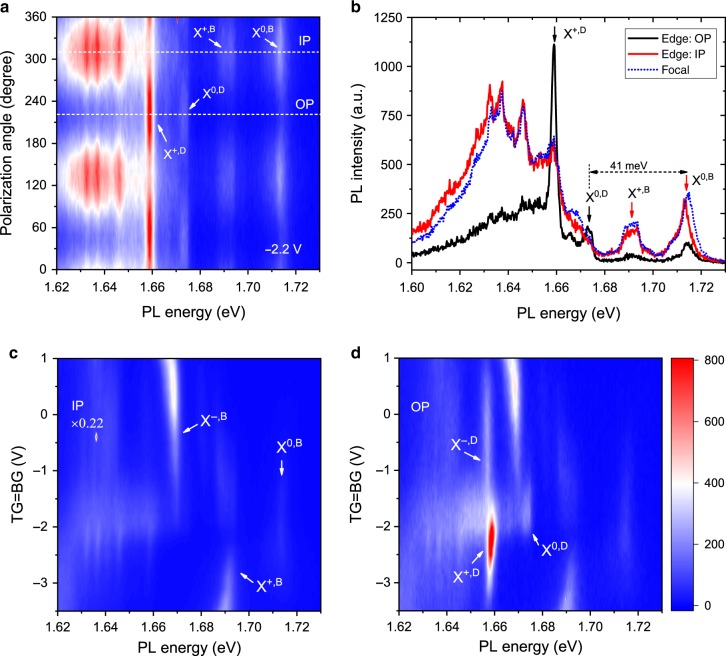
Resolving IP and OP dipoles by polarization. a Contour plot of the edge PL spectrum as a function of polarization direction for a hole-doped WSe2 sample (both gates at −2.2 V). Dashed lines indicate the polarization corresponding to the OP and IP channels. b Comparison of the PL spectrum from the edge OP (black line) and IP (red line) channels and from the focal point (blue dotted line). The latter is rescaled to match the edge IP channel spectrum. c, d Contour plot of the edge PL spectrum as a function of gate voltage for the IP (c) and OP (d) channels. The IP channel is rescaled by a factor of 0.22 so that the PL intensity of the bright electron trion X−,B in two channels have a comparable intensity. The two gates are set to the same voltage, which varies only the doping density in WSe2 with symmetric top (TG) and bottom (BG) gates. The color bar represents the PL intensity in a, c, d. X0,B, X+,B, X0,D, X+,D and X−,D denote the bright exciton, bright hole trion, dark exciton, dark hole trion and dark electron trion, respectively. The energy splitting between the bright and dark exciton (41 meV) in b agrees with the literature value19,20.

