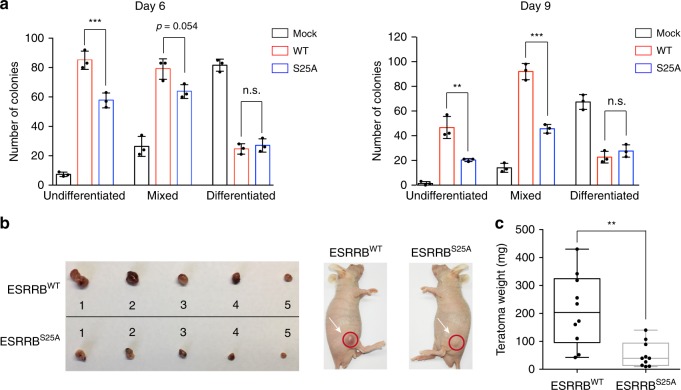
Fig. 5.
ESRRB O-GlcNAcylation enhances self-renewal and pluripotency. a Clonogenicity assay of mESCs stably expressing Mock, FLAG-ESRRBWT and FLAG-ESRRBS25A. Bar graphs showing the statistical analysis of the undifferentiated, mixed and differentiated colonies in the absence of LIF for 6 days (left panel) and 9 days (right panel). Error bars represent mean ± s.d. Results are from three independent experiments. **P < 0.01, ***P < 0.001, n.s., not significant (one-way ANOVA). b Teratoma formation in immunodeficient mice by mESCs expressing FLAG-ESRRB or FLAG-ESRRBS25A. c Box plot showing the statistical analysis of teratoma weight. Median and quartile values are provided by the central line and box boundaries. Whiskers show min to max values. Results are from ten independent experiments. **P < 0.01 (Student’s t-test). Source data for figures a, c are provided as a Source Data file

