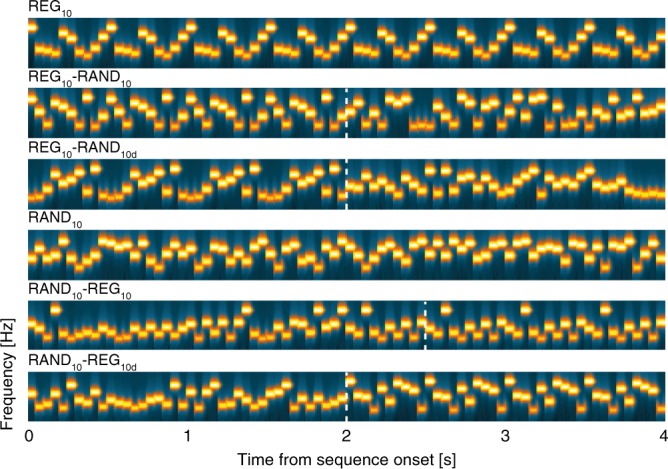
Fig. 4.

Example spectrograms for the additional stimuli used in Experiment 2. REG10 and RAND10 were generated by randomly selecting 10 frequencies from the pool and then either iterating that sequence to create a regularly repeating pattern or presenting them in random order. REG10-RAND10 and RAND10-REG10 sequences were created from the same 10 frequencies (different sets on each trial). Thus, the transition was manifested as a change in pattern only, without the occurrence of a frequency deviant. REG10-RAND10d and RAND10-REG10d were created such that the frequencies used for the REG and RAND portions of the sequence were different (non-overlapping sets of 10 frequencies each). The transition was thus manifested as both a change in pattern, and also as a change in frequency content. The stimulus set also included REG10-RAND20, RAND20-REG10 and RAND20 sequences (identical to those in Experiment 1). Dashed vertical white lines indicate the transition time. Note that for RAND10-REG10 the transition time is defined as occurring after the first full regularity cycle (see also Fig. 1). The transition time is not adjusted for RAND10-REG10d because the transition becomes statistically detectable immediately when the alphabet changes (at the nominal transition time). For presentation purposes, the plotted sequence lengths are equal, but experimental sequences durations varied randomly between 6.0 and 7.5 s
