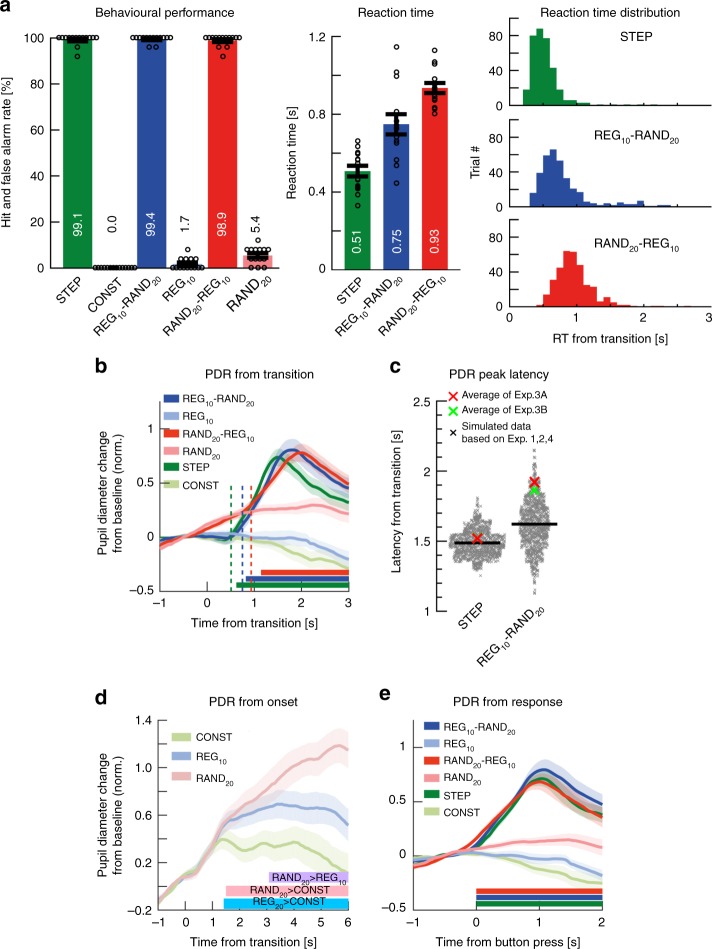
Fig. 6.
Experiment 3A (n = 14): Active transition detection. a Behavioral performance (transition detection). [Left] Hit rates and false positive rates. Circles indicate individual subject data; error bars are ±1 SEM. [Middle] Reaction times (RT). [Right] The distribution of RTs (across trials and participants) for each transition condition. The variance of the RT distribution of RAND20-REG10 was smaller than that of REG10-RAND20 (Levene’s test, F(1,690) = 14.426, p = 0.0002). b Average pupil diameter relative to the transition. Solid lines represent the average normalized pupil diameter, relative to the transition. Shading shows ±1 SEM. Colored horizontal lines indicate time intervals where cluster-level statistics showed significant differences between each change condition and its control. Dashed vertical lines mark the average RT for each condition. Clear PDRs were observed for all three transitions. The PDR to STEP increased from ~490 ms post-transition, peaking at 1500 ms; it statistically diverged from CONST from 620 ms through to sequence offset. For REG10-RAND20, the responses commenced ~750 ms post-transition, peaking at 1800ms, and statistically diverged from REG at 820 ms post-transition through to sequence offset. For RAND20-REG10, the response started at 930 ms, peaked at 1980ms, and statistically diverged from its control RAND20 from 1140 ms onwards. c A comparison of PDR peak latency to STEP and REG10-RAND20 in Experiment 3 relative to Experiments 1, 2, and 4 (see Methods). The scatterplots show the distribution of the simulated peak latency of STEP (left) and REG10-RAND20 (right) in the gap detection experiments. The red and green crosses indicate the mean peak latency in Experiments 3A and 3B (see below), respectively. The results showed no difference for STEP (Exp 3A: mean = 1520 ms, p = 0.338, Expt3B: mean = 1521 ms, p = 0.341), but a greater latency for REG10-RAND20 in Exp 3A (mean = 1921ms, p = 0.048, Exp 3B: mean = 1865ms, p = 0.090). d Average pupil diameter over time relative to the sequence onset. Colored lines indicate time intervals where cluster-level statistics showed significant differences between conditions. RAND20 and REG10 statistically diverged from CONST at 1500 and 1420 ms post-onset, respectively. Interestingly, RAND20 evoked a larger tonic PDR than REG10 from 3080 ms post-onset. e Average pupil diameter over time, relative to button press

