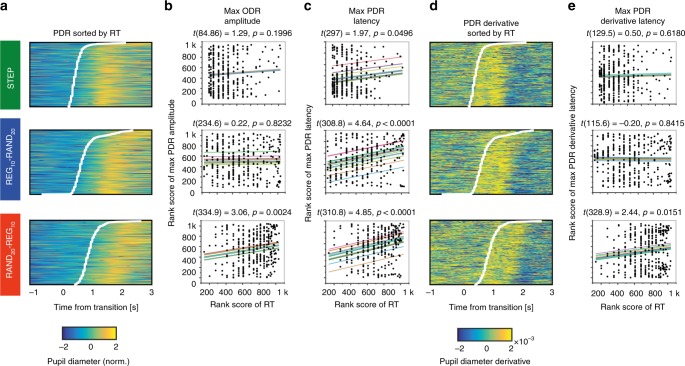
Fig. 7.
Relationship between RT and the pupil dilation response. a Single trials sorted by RT (y-axis, RT indicated by white lines) shown against the time relative to the transition (x-axis) with the colors showing pupil diameter (the warmer the color, the larger the pupil). b Scatter plots show the maximum PDR amplitude for each trial (ranked low to high on the y-axis) versus ranked RT (smaller values faster) for the same trial (x-axis), separated by condition as in a. Each line of fit shows the modeled random effect of subject (offset), with slope the fixed effect of RT. Fixed-effects t-values and associated p-values appear above each fitted scatterplot. c Rank maximum PDR latency vs. RT. Scatterplot and fitting as in b. d Single trials sorted by RT (y-axis, RT indicated by white lines) shown against the time relative to the transition (x-axis) with the colors showing the rate of change of pupil diameter (the warmer the color, the larger the rate of change in pupil size). e Rank maximum derivative latency vs rank RT (scatterplot fits as in c)

