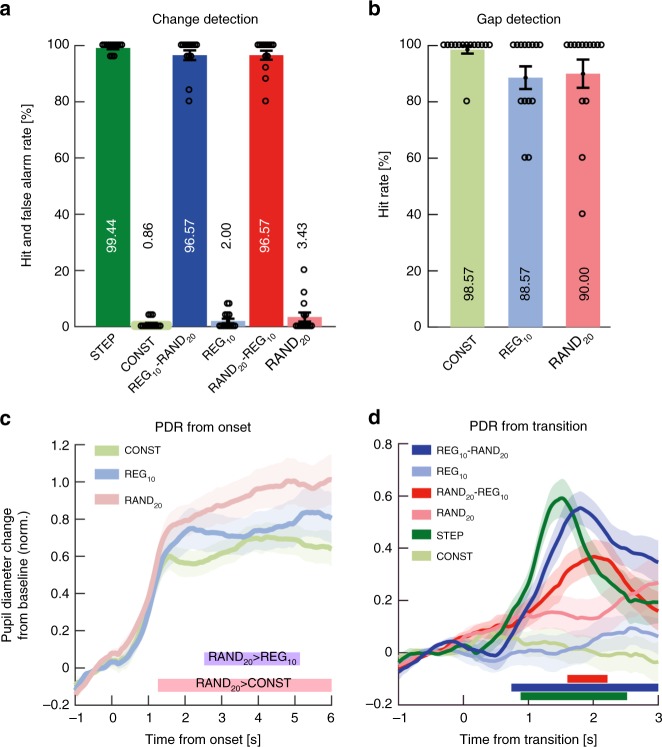
Fig. 8.
Experiment 3B (n = 14): Active transition detection (delayed response). a Transition detection task: Hit rates and false positive rates. Circles indicate individual subject data; error bars are ±1 SEM. b Gap detection task. c Average pupil diameter over time relative to sequence onset. Colored lines indicate time intervals where cluster-level statistics showed significant differences between conditions. RAND20 statistically diverged from CONST at 1260 ms through to sequence offset and from REG10 between 2520 ms and 5120 ms post-onset. d Average pupil diameter relative to the transition. Shading shows ±1 SEM. Colored horizontal lines indicate time intervals where cluster-level statistics showed significant differences between each change condition and its control. The PDR to STEP increased from ~200 ms post-transition, peaking at 1520 ms; it statistically diverged from CONST between 880 and 2520 ms. For REG10-RAND20, the responses commenced ~500 ms post-transition, peaking at 1800ms, and statistically diverged from REG at 740 ms post-transition through to sequence offset. For RAND20-REG10, the response rose at 1000 ms, peaked at 2020 ms, and statistically diverged from its control RAND20 between 1600 and 2220 ms

