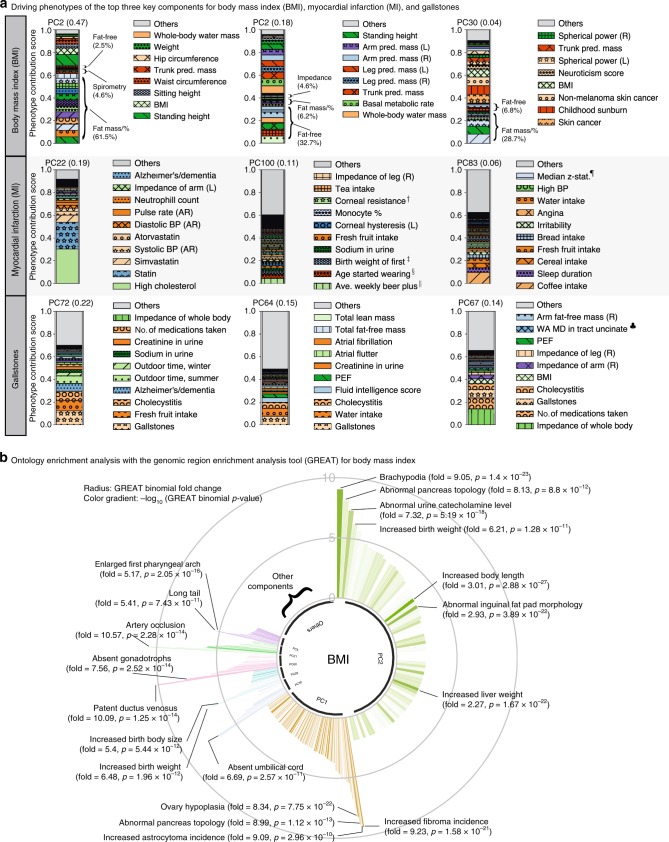
Fig. 3.
The top three key DeGAs components for BMI, MI, and gallstones. a The top three key components for each phenotype are identified by phenotype squared cosine scores and characterized with the driving phenotypes by phenotype contribution scores (Methods). Each colored segment represents a phenotype with at least 0.5% of phenotype contribution scores for each of the component and the rest of the phenotypes are aggregated as others and shown as the gray bar on the top. For BMI, additional phenotype grouping is applied (Methods, Supplementary Table 2). b Biological characterization of driving non-coding and coding variants of the key components for BMI with GREAT. The key components are shown proportional to their squared cosine score along with significantly enriched terms in mouse MGI phenotype ontology. The radius represents binomial fold change and the color gradient represents −log10(p-value) from GREAT ontology enrichment analysis. pred.: predicted, #: number, %: percentage, mass/% mass and percentage, BP: blood pressure, AR: automated reading, L: left, R: right, WA: weighted average. †: Corneal resistance factor (right), ‡: Birth weight of first child, §: Age started wearing glasses or contact lenses, ||: Average weekly beer plus cider intake, ¶: Median z-statistic (in group-defined mask) for shapes activation, ♣: Weighted-mean MD in tract uncinate fasciculus (right). Source data are provided in Supplementary Data 2-3

