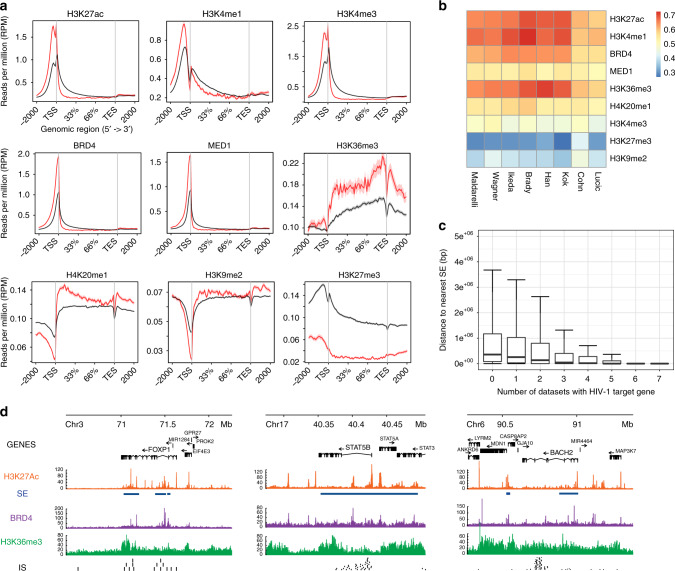
Fig. 1.
HIV-1 integration hotspots are within genes proximal to super-enhancers (SEs). a Metagene plots of H3K27ac, H3K4me1, H3K4me3, BRD4, MED1, H3K36me3, H4K20me1, H3K9me2, and H3K27me3 ChIP-Seq signals in recurrent integration genes (RIGs), which are protein coding in red and the rest of the protein-coding genes that are not targeted by HIV-1 (no RIGs) in black. b ROC analysis represented in heatmap summarizing the co-occurrence of integration sites and epigenetic modification obtained by ChIP-Seq for H3K27ac, H3K4me1, BRD4, MED1, H3K36me3, H4K20me1, H3K4me3, H3K27me3, and H3K9me2. HIV-1 integration datasets are shown in the columns, and epigenetic modifications are shown in rows. Associations are quantified using the ROC area method; values of ROC areas are shown in the color key at the right. c Distance to the nearest SE in activated CD4+ T cells. Box plots represent distances from the gene to the nearest SE grouped by number of times the gene is found in different datasets. d FOXP1, STAT5B, and BACH2 IS (black) superimposition on H3K27ac (orange), SE (blue), H3K36me3 (green), and BRD4 (violet) ChIP-Seq tracks

