Fig. 3.
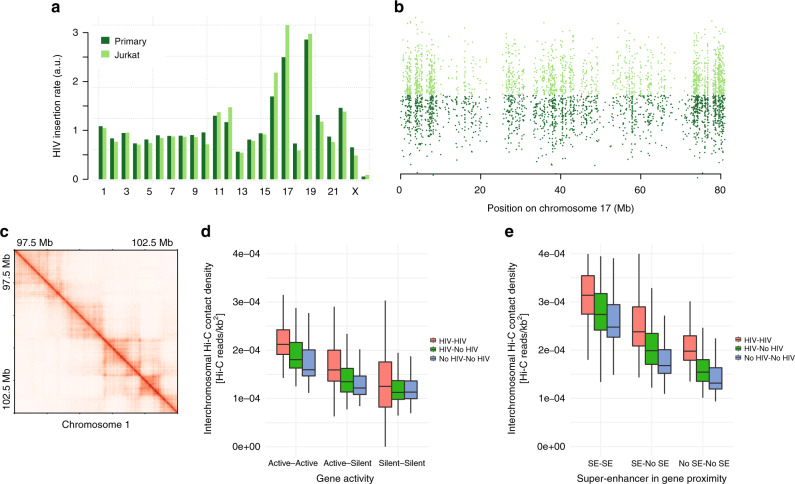
HIV-1 integration hotspots are clustered in the nuclear space. a Bar plot of HIV-1 insertion rate per chromosome (the genome-wide average is set to 1) in primary T and in Jurkat cells. b HIV-1 insertion cloud on chromosome 17 in primary T and Jurkat cells. Each dot represents an HIV-1 insertion site. The x-coordinate indicates the location of the insertion site on chromosome 17; the y-coordinate is random so that insertion hotspots appear as vertical lines. c Detail of the unnormalized Hi-C contact map in Jurkat in 5 kb bins. TADs and loop domains are clearly visible. d Box plot of inter-chromosomal Hi-C contact density (see “Methods”). Contact densities were computed between chromosomal aggregates of all gene fragments (5 kb) corresponding to Active and Silent genes, with (HIV) or without HIV insertions (No HIV). The distribution of densities are composed of the scores for all inter-chromosomal combinations. e Same as in d, but genes are classified between genes in proximity of super-enhancers (SE), i.e., within gene body or 5 kb upstream of TSS, or far from super-enhancers (No SE)

