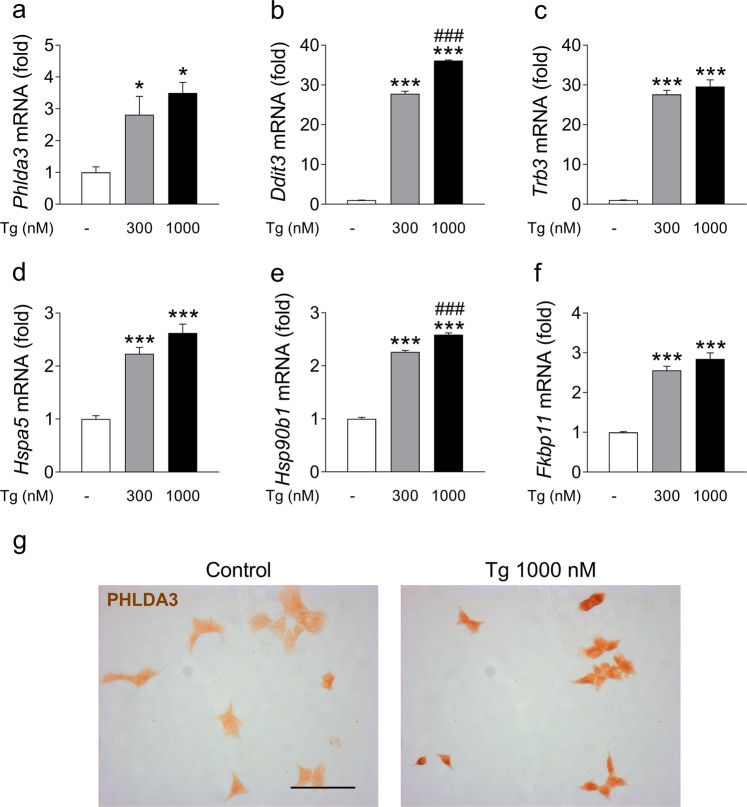
Figure 3.
Phlda3 mRNA and protein levels are upregulated by thapsigargin treatment in parallel with the induction of ER stress genes. MIN6 cells were cultured for 24 h in the absence (white bars) or presence of 300 nmol/l (grey bars) or 1000 nmol/l (black bars) thapsigargin (Tg). Changes in the mRNA levels of Phlda3, Hmox1, Trb3, Hspa5, Hsp90b1 and Fkbp11 (a–f) and PHLDA3 immunostaining (g). *p < 0.05, ***p < 0.001 vs control. ###p < 0.001 vs thapsigargin 300 nM. Scale bar, 50 µm.

